EX-99.1
Published on September 26, 2024

Thursday, September 26, 2024 9:00 AM 2:30 PM CDT

Southwest. Even Better. Julia Landrum
Cautionary statement regarding forward-looking statements The Companys 2024 Investor Day presentations and slides contain forward-looking statements within the meaning of Section 27A of the Securities Act of 1933, as amended, and Section 21E of the Securities Exchange Act of 1934, as amended. Forward-looking statements are based on, and include statements about, the Companys current estimates, intentions, beliefs, expectations, goals, strategies, and projections for the future and are not guarantees of future performance. Specific forward-looking statements can be identified by the fact that they do not relate strictly to historical or current facts and include, without limitation, statements related to (i) the Companys initiatives, strategic priorities and focus areas, plans, goals, and opportunities, including with respect to (a) driving future prosperity and restoring earnings power and margins, (b) enhancing efficiency and productivity, growth initiatives and efficient use of capital, and capital allocation, (c) increasing return on invested capital, (d) staffing initiatives; (e) creating value for Shareholders and Shareholder returns, (f) sustainable and consistent performance, profitability, returns on invested capital, and free cash flows, (g) maintaining investment grade credit rating, (h) broadening the Customer base and distribution evolution, (i) inventory strategies and improving revenue performance and revenue management (j) protecting market share and increasing loyalty, (k) monetizing the Companys value proposition and enhancing its competitive edge, (l) efficient capacity and reduced leverage, (m) managing and mitigating cost pressures and removing costs, (n) extracting value from the fleet and the fleet order book, (o) growing managed business travel and attracting new Customers; and (p) innovation, technology, Customer Service modernization, and Customer Experience enhancements; (ii) the Companys plans and expectations with respect to its network, its capacity, its network optimization efforts, its network plan, network restructurings, market maturation, refining connection opportunities, and capacity and network adjustments, including its plans and expectations with respect to redeye flying and 24-hour operation capabilities; and including factors and assumptions underlying the Companys expectations and projections; (iii) the Companys financial and operational outlook, expectations, goals, plans, strategies, and projected results of operations, including with respect to its initiatives, and including factors and assumptions underlying the Companys expectations and projections; (iv) the Companys expectations with respect to the U.S. airline industry, Passenger demand, and backdrop trends; (v) the Companys plans and expectations with respect to assigned and premium seating, including expected benefits, Customer demand, timing of implementation and bookings, retrofits, cabin layout, and FAA certification; (vi) the Companys plans and expectations with respect to airline partnerships and enhanced vacation products, including Getaways by Southwest; (vii) the Companys plans and expectations with respect to aircraft turn-time; (viii) the Companys fleet plans and expectations, including with respect to fleet utilization, fleet modernization, fleet management, flexibility, expected fleet deliveries and retirements, refreshed cabin design, in-seat power, larger overhead bins, increased WiFi, and new RECARO seats, and including factors and assumptions underlying the Companys plans and expectations; (ix) the Companys plans and expectations to drive Passenger demand, Customer loyalty, Passenger yield, and load factors, including the Companys associated forecasted load factors; (x) the Companys expectations with respect to market share of business travelers; (xi) the Companys plans and expectations with respect to its Rapid Rewards Program, including planned enhancements, and loyalty revenue performance; (xii) the Companys plans and expectations for Customer seating and boarding offerings; (xiii) the Companys plans and expectations with respect to the boarding model; (xiv) the Companys labor plans and expectations, including the Companys hiring and headcount plans and expectations; (xv) the Companys expectations with respect to fuel costs, hedging gains, and fuel efficiency, and the Companys related management of risks associated with changing jet fuel prices, including factors underlying the Companys expectations; (xvi) the Companys plans, estimates, and assumptions related to repayment of debt obligations, leverage, credit ratings, capital spending, infrastructure spending, capital allocation, and Shareholder returns, including factors and assumptions underlying the Companys expectations and projections; (xvii) the Companys plans, expectations, and goals with respect to environmental sustainability; (xviii) the Companys plans and expectations with respect to aircraft maintenance; and (xix) the Companys expectations with respect to any compensation received from Boeing for financial damages associated with aircraft delivery delays. Forward-looking statements involve risks, uncertainties, assumptions, and other factors that are difficult to predict and that could cause actual results to vary from those expressed in or indicated by them. Factors include, among others, (i) the impact of fears or actual outbreaks of diseases, extreme or severe weather and natural disasters, actions of competitors (including, without limitation, pricing, scheduling, capacity, and network decisions, and consolidation and alliance activities), consumer perception, economic conditions, banking conditions, fears or actual acts of terrorism or war, sociodemographic trends, and other factors beyond the Companys control, on consumer behavior and the Companys results of operations and business decisions, plans, strategies, and results; (ii) the Companys ability to timely and effectively implement, transition, operate, and maintain the necessary information technology systems and infrastructure to support its operations and initiatives, including with respect to revenue management and assigned and premium seating; (iii) the cost and effects of the actions of activist shareholders; (iv) the Companys ability to obtain and maintain adequate infrastructure and equipment to support its operations and initiatives; (v) the impact of fuel price changes, fuel price volatility, volatility of commodities used by the Company for hedging jet fuel, and any changes to the Companys fuel hedging strategies and positions, on the Companys business plans and results of operations; (vi) the Companys dependence on The Boeing Company (Boeing) and Boeing suppliers with respect to the Companys aircraft deliveries, Boeing MAX 7 aircraft certifications, fleet and capacity plans, operations, maintenance, strategies, and goals; (vii) the Companys dependence on the Federal Aviation Administration with respect to safety approvals for the new cabin layout and the certification of the Boeing MAX 7 aircraft; (viii) the Companys dependence on other third parties, in particular with respect to its technology plans, its plans and expectations related to revenue management, operational reliability, fuel supply, maintenance, Global Distribution Systems, environmental sustainability, and the impact on the Companys operations and results of operations of any third party delays or nonperformance; (ix) the Companys ability to timely and effectively prioritize its initiatives and focus areas and related expenditures; (x) the impact of labor matters on the Companys business decisions, plans, strategies, and results; (xi) the impact of governmental regulations and other governmental actions on the Companys business plans, results, and operations; (xii) the Companys dependence on its workforce, including its ability to employ and retain sufficient numbers of qualified Employees with appropriate skills and expertise to effectively and efficiently maintain its operations and execute the Companys plans, strategies, and initiatives; (xiii) the emergence of additional costs or effects associated with the cancelled flights in December 2022, including litigation, government investigation and actions, and internal actions; and (xiv) other factors, as described in the Companys filings with the Securities and Exchange Commission, including the detailed factors discussed under the heading Risk Factors in the Companys Annual Report on Form 10-K for the fiscal year ended December 31, 2023, and in the Companys Quarterly Report on Form 10-Q for the fiscal quarter ended June 30, 2024. Notice Regarding Third Party Content This presentation may contain information obtained from third parties, including ratings from credit ratings agencies such as S&P Global Ratings. Reproduction and distribution of third party content in any form is prohibited except with the prior written permission of the related third party. Third party content providers do not guarantee the accuracy, completeness, timeliness or availability of any information, including ratings, and are not responsible for any errors or omissions (negligent or otherwise), regardless of the cause, or for the results obtained from the use of such content. Third party content providers give no express or implied warranties, including, but not limited to, any warranties of merchantability or fitness for a particular purpose or use. Third party content providers shall not be liable for any direct, indirect, incidental, exemplary, compensatory, punitive, special or consequential damages, costs, expenses, legal fees, or losses (including lost income or profits and opportunity costs or losses caused by negligence) in connection with any use of their content, including ratings. Credit ratings are statements of opinions and are not statements of fact or recommendations to purchase, hold or sell securities. They do not address the suitability of securities or the suitability of securities for investment purposes and should not be relied on as investment advice. 3
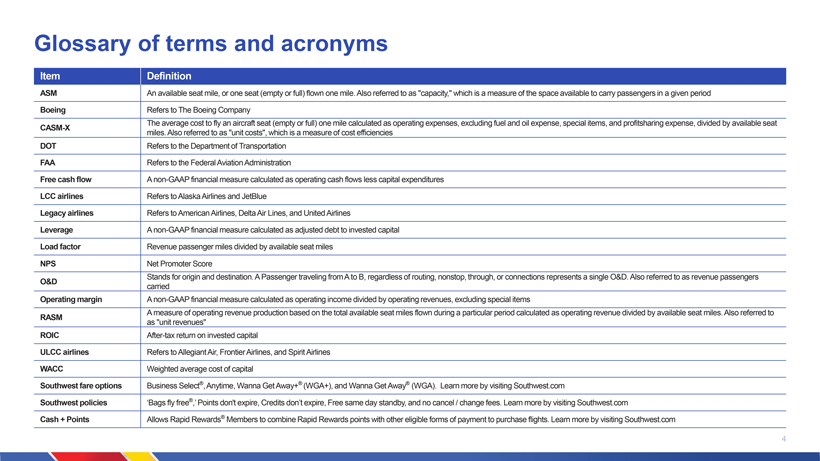
Glossary of terms and acronyms Item Definition ASM An available seat mile, or one seat (empty or full) flown one mile. Also referred to as capacity, which is a measure of the space available to carry passengers in a given period Boeing Refers to The Boeing Company The average cost to fly an aircraft seat (empty or full) one mile calculated as operating expenses, excluding fuel and oil expense, special items, and profitsharing expense, divided by available seat CASM-X miles. Also referred to as unit costs, which is a measure of cost efficiencies DOT Refers to the Department of Transportation FAA Refers to the Federal Aviation Administration Free cash flow A non-GAAP financial measure calculated as operating cash flows less capital expenditures LCC airlines Refers to Alaska Airlines and JetBlue Legacy airlines Refers to American Airlines, Delta Air Lines, and United Airlines Leverage A non-GAAP financial measure calculated as adjusted debt to invested capital Load factor Revenue passenger miles divided by available seat miles NPS Net Promoter Score Stands for origin and destination. A Passenger traveling from A to B, regardless of routing, nonstop, through, or connections represents a single O&D. Also referred to as revenue passengers O&D carried Operating margin A non-GAAP financial measure calculated as operating income divided by operating revenues, excluding special items A measure of operating revenue production based on the total available seat miles flown during a particular period calculated as operating revenue divided by available seat miles. Also referred to RASM as unit revenues ROIC After-tax return on invested capital ULCC airlines Refers to Allegiant Air, Frontier Airlines, and Spirit Airlines WACC Weighted average cost of capital Southwest fare options Business Select®, Anytime, Wanna Get Away+® (WGA+), and Wanna Get Away® (WGA). Learn more by visiting Southwest.com Southwest policies Bags fly free®, Points dont expire, Credits dont expire, Free same day standby, and no cancel / change fees. Learn more by visiting Southwest.com Cash + Points Allows Rapid Rewards® Members to combine Rapid Rewards points with other eligible forms of payment to purchase flights. Learn more by visiting Southwest.com 4
Bob Jordan Todays Southwest. Bob Jordan President, Chief Executive Officer, Even Better. and Vice Chairman of the Board agenda Driving revenue and profitability Andrew Watterson by optimizing operations Chief Operating Officer Transforming our Customer Ryan Green Executive Vice President value proposition Commercial Transformation Transforming for sustainable Tammy Romo Executive Vice President and profitability and Shareholder returns Chief Financial Officer Closing Remarks Q&A 5
Southwest. Even Better. Bob Jordan
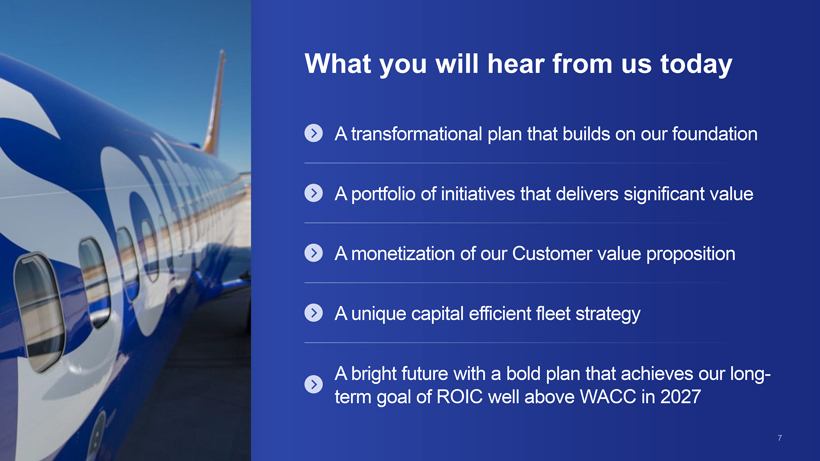
What you will hear from us today A transformational plan that builds on our foundation A portfolio of initiatives that delivers significant value A monetization of our Customer value proposition A unique capital efficient fleet strategy A bright future with a bold plan that achieves our long-term goal of ROIC well above WACC in 2027 7
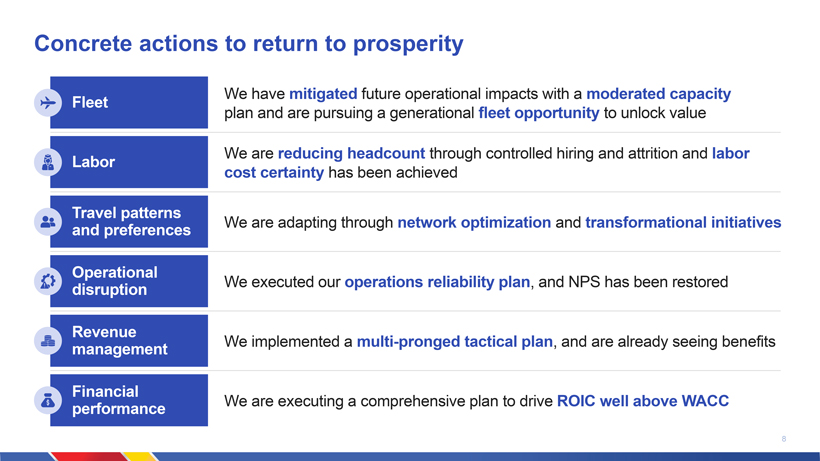
Concrete actions to return to prosperity We have mitigated future operational impacts with a moderated capacity Fleet plan and are pursuing a generational fleet opportunity to unlock value We are reducing headcount through controlled hiring and attrition and labor Labor cost certainty has been achieved Travel patterns We are adapting through network optimization and transformational initiatives and preferences Operational We executed our operations reliability plan, and NPS has been restored disruption Revenue We implemented a multi-pronged tactical plan, and are already seeing benefits management Financial We are executing a comprehensive plan to drive ROIC well above WACC performance 8
Our unique history and industry-leading position
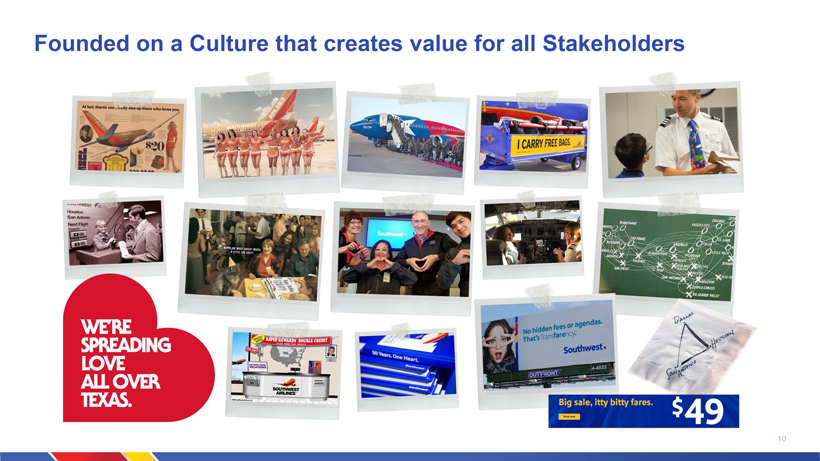
Founded on a Culture that creates value for all Stakeholders 1
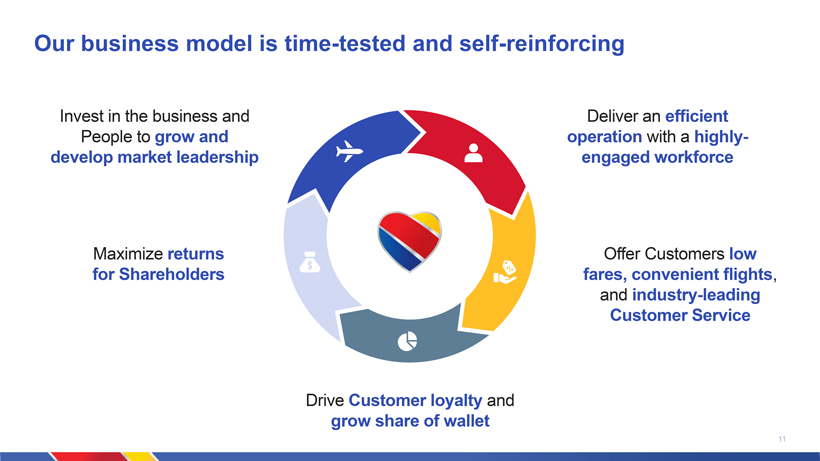
Our business model is time-tested and self-reinforcing Invest in the business and Deliver an efficient People to grow and operation with a highly-develop market leadership engaged workforce Maximize returns Offer Customers low for Shareholders fares, convenient flights, and industry-leading Customer Service Drive Customer loyalty and grow share of wallet 11
It starts with our People and our Culture
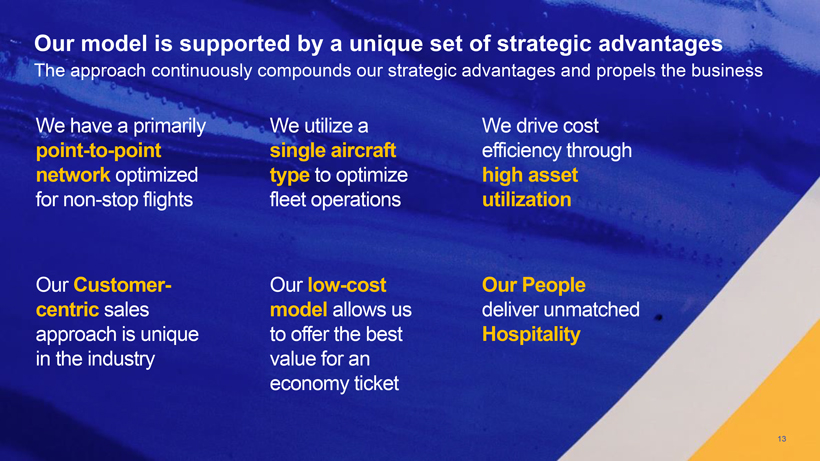
Our model is supported by a unique set of strategic advantages The approach continuously compounds our strategic advantages and propels the business We have a primarily We utilize a We drive cost point-to-point single aircraft efficiency through network optimized type to optimize high asset for non-stop flights fleet operations utilization Our Customer- Our low-cost Our People centric sales model allows us deliver unmatched approach is unique to offer the best Hospitality in the industry value for an economy ticket 13
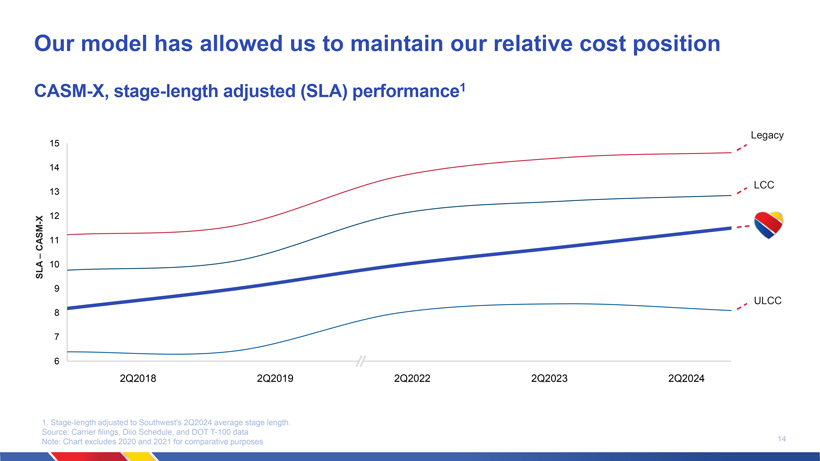
Our model has allowed us to maintain our relative cost position CASM-X, stage-length adjusted (SLA) performance1 15 Legacy 14 LCC 13 X 12 -CASM 11 10 SLA 9 ULCC 8 7 6 2Q2018 2Q2019 2Q2022 2Q2023 2Q2024 1. Stage-length adjusted to Southwests 2Q2024 average stage length. Source: Carrier filings, Diio Schedule, and DOT T-100 data 14 Note: Chart excludes 2020 and 2021 for comparative purposes
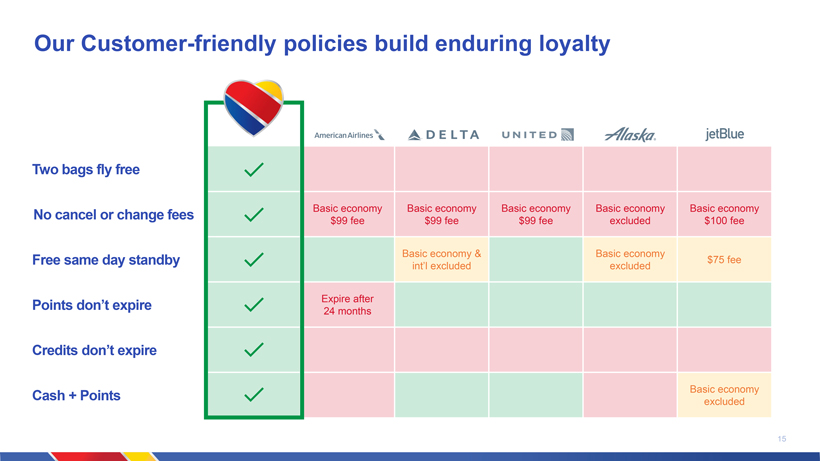
Our Customer-friendly policies build enduring loyalty Two bags fly free No cancel or change fees Basic economy Basic economy Basic economy Basic economy Basic economy $99 fee $99 fee $99 fee excluded $100 fee Basic economy & Basic economy Free same day standby $75 fee intl excluded excluded Points dont expire Expire after 24 months Credits dont expire Cash + Points Basic economy excluded 15
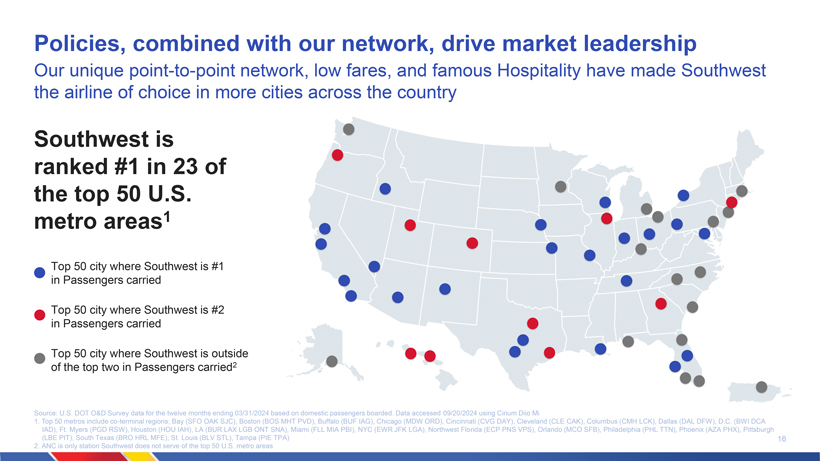
Policies, combined with our network, drive market leadership Our unique point-to-point network, low fares, and famous Hospitality have made Southwest the airline of choice in more cities across the country Southwest is ranked #1 in 23 of the top 50 U.S. metro areas1 Top 50 city where Southwest is #1 in Passengers carried Top 50 city where Southwest is #2 in Passengers carried Top 50 city where Southwest is outside of the top two in Passengers carried2 Source: U.S. DOT O&D Survey data for the twelve months ending 03/31/2024 based on domestic passengers boarded. Data accessed 09/20/2024 using Cirium Diio Mi 1. Top 50 metros include co-terminal regions; Bay (SFO OAK SJC), Boston (BOS MHT PVD), Buffalo (BUF IAG), Chicago (MDW ORD), Cincinnati (CVG DAY), Cleveland (CLE CAK), Columbus (CMH LCK), Dallas (DAL DFW), D.C. (BWI DCA IAD), Ft. Myers (PGD RSW), Houston (HOU IAH), LA (BUR LAX LGB ONT SNA), Miami (FLL MIA PBI), NYC (EWR JFK LGA), Northwest Florida (ECP PNS VPS), Orlando (MCO SFB), Philadelphia (PHL TTN), Phoenix (AZA PHX), Pittsburgh (LBE PIT), South Texas (BRO HRL MFE), St. Louis (BLV STL), Tampa (PIE TPA) 16 2. ANC is only station Southwest does not serve of the top 50 U.S. metro areas
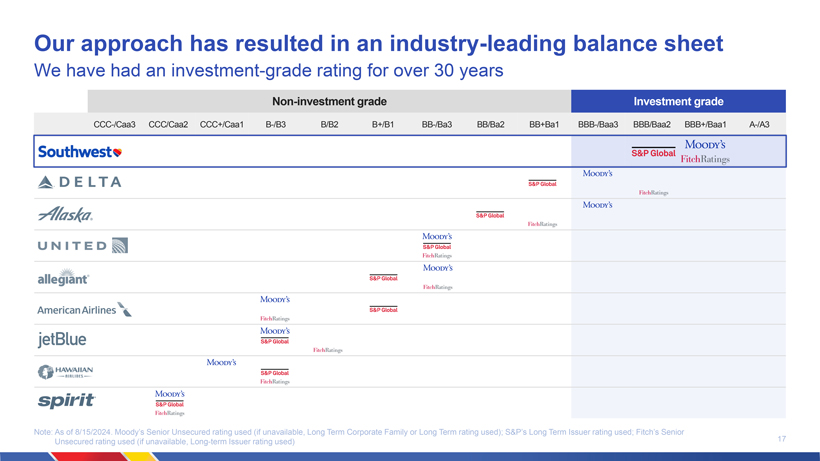
Our approach has resulted in an industry-leading balance sheet We have had an investment-grade rating for over 30 years Non-investment grade Investment grade CCC-/Caa3 CCC/Caa2 CCC+/Caa1 B-/B3 B/B2 B+/B1 BB-/Ba3 BB/Ba2 BB+Ba1 BBB-/Baa3 BBB/Baa2 BBB+/Baa1 A-/A3 Note: As of 8/15/2024. Moodys Senior Unsecured rating used (if unavailable, Long Term Corporate Family or Long Term rating used); S&Ps Long Term Issuer rating used; Fitchs Senior 17 Unsecured rating used (if unavailable, Long-term Issuer rating used)
An improving industry backdrop
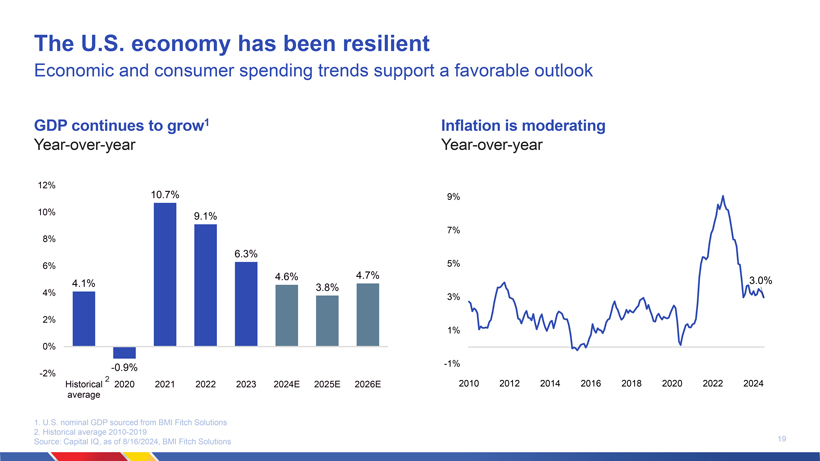
The U.S. economy has been resilient Economic and consumer spending trends support a favorable outlook GDP continues to grow1 Inflation is moderating Year-over-year Year-over-year 12% 10.7% 9% 10% 9.1% 7% 8% 6.3% 6% 5% 4.6% 4.7% 4.1% 3.0% 3.8% 4% 3% 2% 1% 0% -0.9% -1% -2% 2 Historical 2020 2021 2022 2023 2024E 2025E 2026E 2010 2012 2014 2016 2018 2020 2022 2024 average 1. U.S. nominal GDP sourced from BMI Fitch Solutions 2. Historical average 2010-2019 19 Source: Capital IQ, as of 8/16/2024, BMI Fitch Solutions
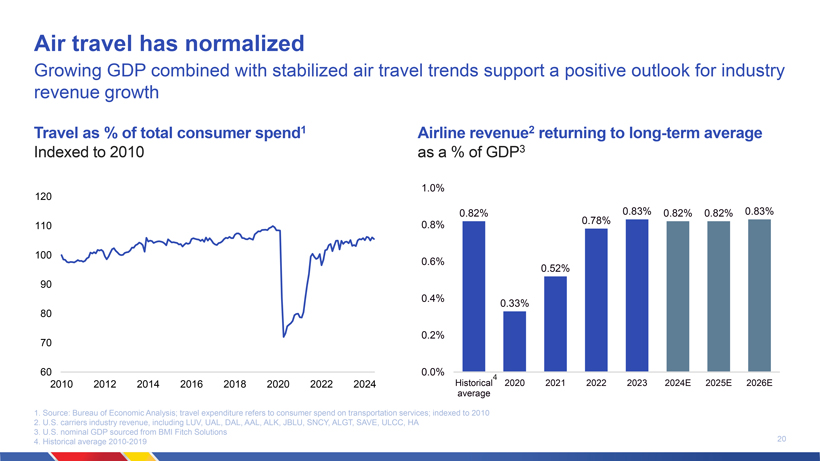
Air travel has normalized Growing GDP combined with stabilized air travel trends support a positive outlook for industry revenue growth Travel as % of total consumer spend1 Airline revenue2 returning to long-term average Indexed to 2010 as a % of GDP3 1.0% 120 0.82% 0.78% 0.83% 0.82% 0.82% 0.83% 110 0.8% 100 0.6% 0.52% 90 0.4% 0.33% 80 0.2% 70 60 0.0% 4 2010 2012 2014 2016 2018 2020 2022 2024 Historical 2020 2021 2022 2023 2024E 2025E 2026E average 1. Source: Bureau of Economic Analysis; travel expenditure refers to consumer spend on transportation services; indexed to 2010 2. U.S. carriers industry revenue, including LUV, UAL, DAL, AAL, ALK, JBLU, SNCY, ALGT, SAVE, ULCC, HA 3. U.S. nominal GDP sourced from BMI Fitch Solutions 20 4. Historical average 2010-2019
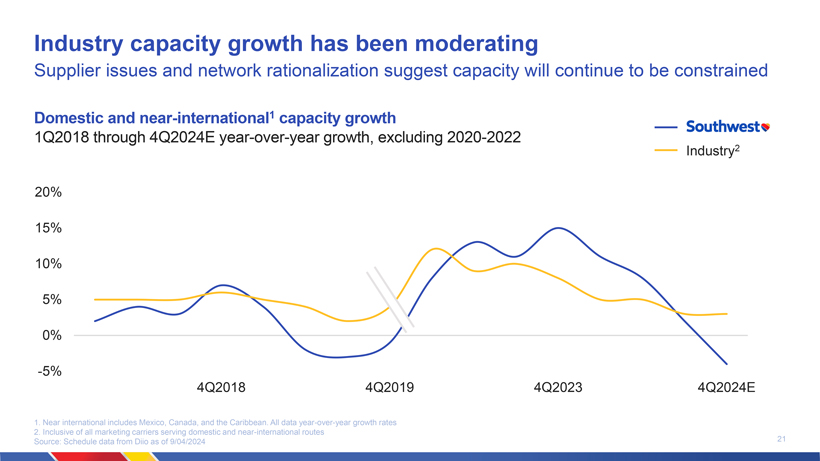
Industry capacity growth has been moderating Supplier issues and network rationalization suggest capacity will continue to be constrained Domestic and near-international1 capacity growth 1Q2018 through 4Q2024E year-over-year growth, excluding 2020-2022 20% 15% 10% 5% 0% -5% 4Q2018 4Q2019 4Q2023 4Q2024E 1. Near international includes Mexico, Canada, and the Caribbean. All data year-over-year growth rates 2. Inclusive of all marketing carriers serving domestic and near-international routes 21 Source: Schedule data from Diio as of 9/04/2024
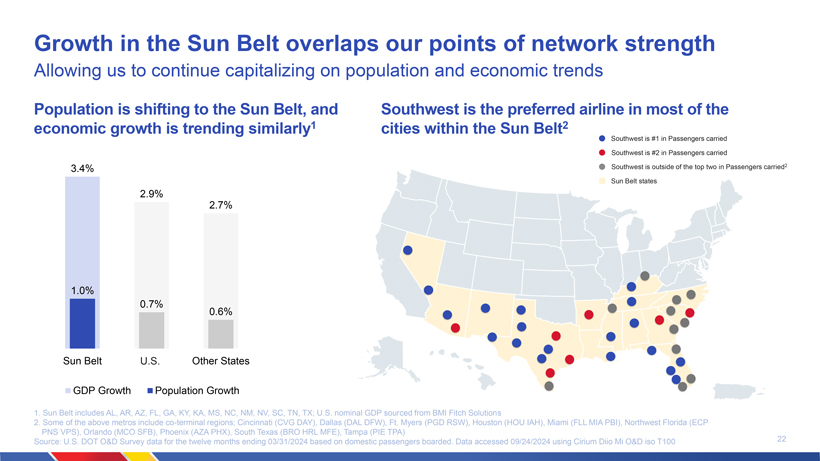
Growth in the Sun Belt overlaps our points of network strength Allowing us to continue capitalizing on population and economic trends Population is shifting to the Sun Belt, and Southwest is the preferred airline in most of the economic growth is trending similarly1 cities within the Sun Belt2 Southwest is #1 in Passengers carried Southwest is #2 in Passengers carried 3.4% Southwest is outside of the top two in Passengers carried2 Sun Belt states 2.9% 2.7% 1.0% 0.7% 0.6% Sun Belt U.S. Other States GDP Growth Population Growth 1. Sun Belt includes AL, AR, AZ, FL, GA, KY, KA, MS, NC, NM, NV, SC, TN, TX; U.S. nominal GDP sourced from BMI Fitch Solutions 2. Some of the above metros include co-terminal regions; Cincinnati (CVG DAY), Dallas (DAL DFW), Ft. Myers (PGD RSW), Houston (HOU IAH), Miami (FLL MIA PBI), Northwest Florida (ECP PNS VPS), Orlando (MCO SFB), Phoenix (AZA PHX), South Texas (BRO HRL MFE), Tampa (PIE TPA) 22 Source: U.S. DOT O&D Survey data for the twelve months ending 03/31/2024 based on domestic passengers boarded. Data accessed 09/24/2024 using Cirium Diio Mi O&D iso T100
Transforming for sustainable performance and Shareholder returns
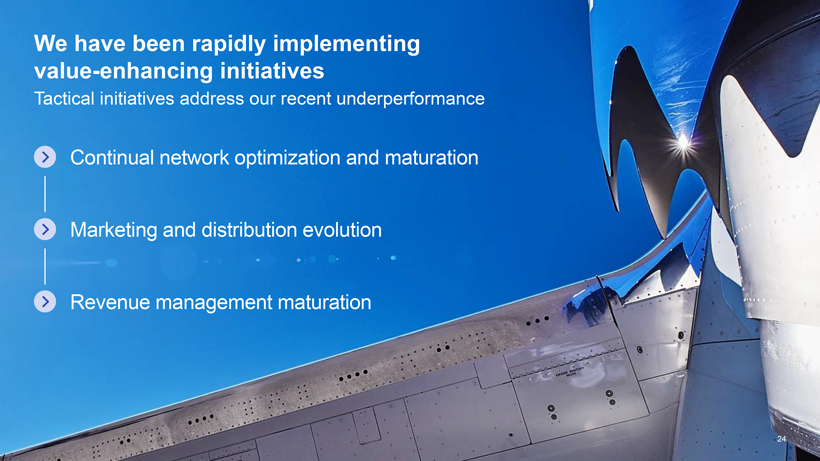
We have been rapidly implementing value-enhancing initiatives Tactical initiatives address our recent underperformance Continual network optimization and maturation Marketing and distribution evolution Revenue management maturation
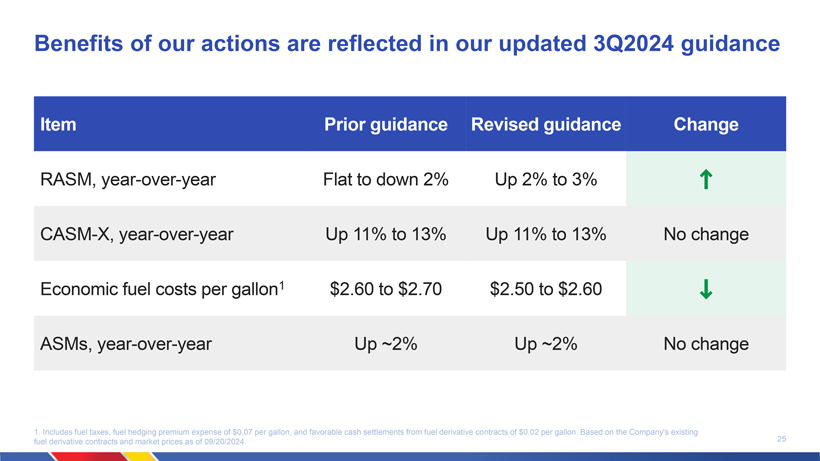
Benefits of our actions are reflected in our updated 3Q2024 guidance Item Prior guidance Revised guidance Change RASM, year-over-year Flat to down 2% Up 2% to 3% CASM-X, year-over-year Up 11% to 13% Up 11% to 13% No change Economic fuel costs per gallon1 $2.60 to $2.70 $2.50 to $2.60 ASMs, year-over-year Up ~2% Up ~2% No change 1. Includes fuel taxes, fuel hedging premium expense of $0.07 per gallon, and favorable cash settlements from fuel derivative contracts of $0.02 per gallon. Based on the Companys existing 25 fuel derivative contracts and market prices as of 09/20/2024.
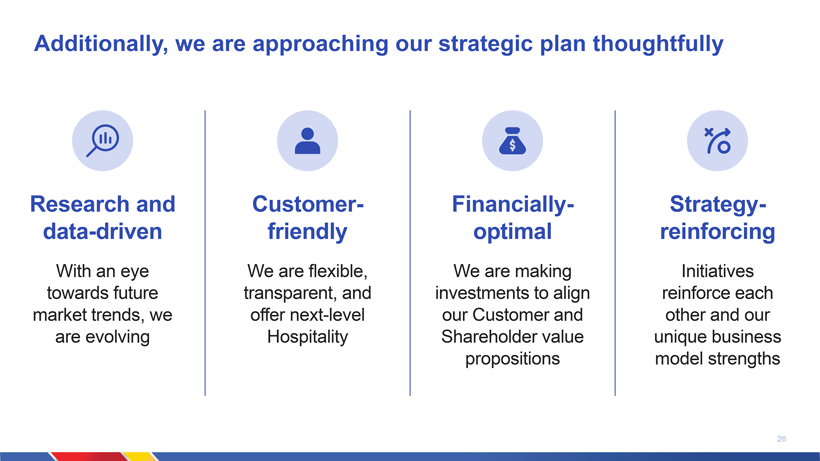
Additionally, we are approaching our strategic plan thoughtfully Research and Customer- Financially- Strategy- data-driven friendly optimal reinforcing With an eye We are flexible, We are making Initiatives towards future transparent, and investments to align reinforce each market trends, we offer next-level our Customer and other and our are evolving Hospitality Shareholder value unique business propositions model strengths 26
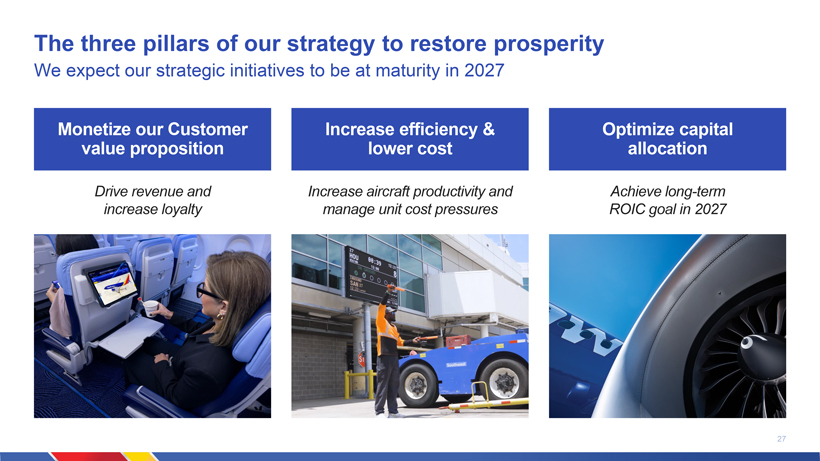
The three pillars of our strategy to restore prosperity We expect our strategic initiatives to be at maturity in 2027 Monetize our Customer Increase efficiency & Optimize capital value proposition lower cost allocation Drive revenue and Increase aircraft productivity and Achieve long-term increase loyalty manage unit cost pressures ROIC goal in 2027 27
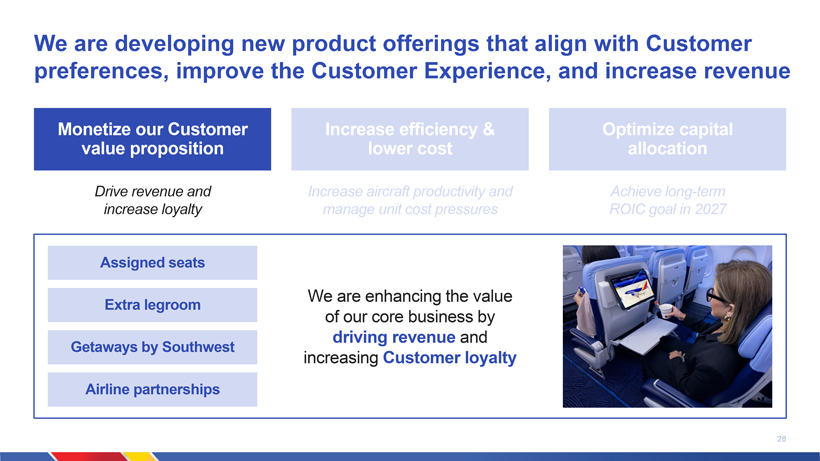
We are developing new product offerings that align with Customer preferences, improve the Customer Experience, and increase revenue Monetize our Customer Increase efficiency & Optimize capital value proposition lower cost allocation Drive revenue and Increase aircraft productivity and Achieve long-term increase loyalty manage unit cost pressures ROIC goal in 2027 Assigned seats We are enhancing the value Extra legroom of our core business by driving revenue and Getaways by Southwest increasing Customer loyalty Airline partnerships 28
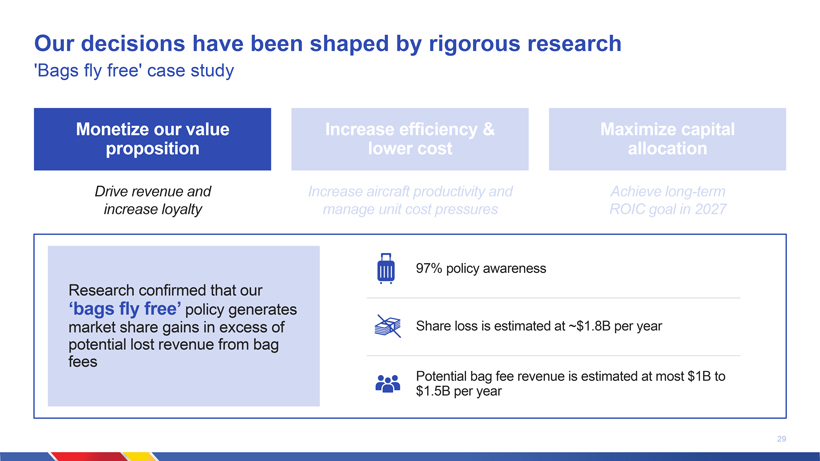
Our decisions have been shaped by rigorous research Bags fly free case study Monetize our value Increase efficiency & Maximize capital proposition lower cost allocation Drive revenue and Increase aircraft productivity and Achieve long-term increase loyalty manage unit cost pressures ROIC goal in 2027 97% policy awareness Research confirmed that our bags fly free policy generates market share gains in excess of Share loss is estimated at ~$1.8B per year potential lost revenue from bag fees Potential bag fee revenue is estimated at most $1B to $1.5B per year 29
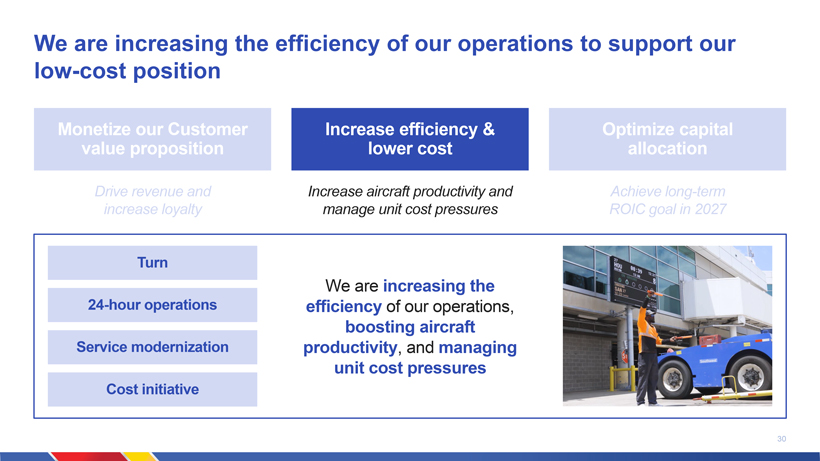
We are increasing the efficiency of our operations to support our low-cost position Monetize our Customer Increase efficiency & Optimize capital value proposition lower cost allocation Drive revenue and Increase aircraft productivity and Achieve long-term increase loyalty manage unit cost pressures ROIC goal in 2027 Turn We are increasing the 24-hour operations efficiency of our operations, boosting aircraft Service modernization productivity, and managing unit cost pressures Cost initiative 30
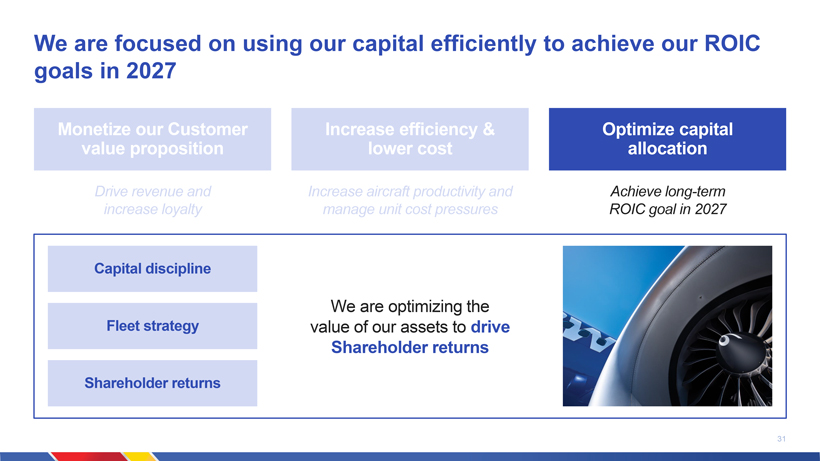
We are focused on using our capital efficiently to achieve our ROIC goals in 2027 Monetize our Customer Increase efficiency & Optimize capital value proposition lower cost allocation Drive revenue and Increase aircraft productivity and Achieve long-term increase loyalty manage unit cost pressures ROIC goal in 2027 Capital discipline We are optimizing the Fleet strategy value of our assets to drive Shareholder returns Shareholder returns 31
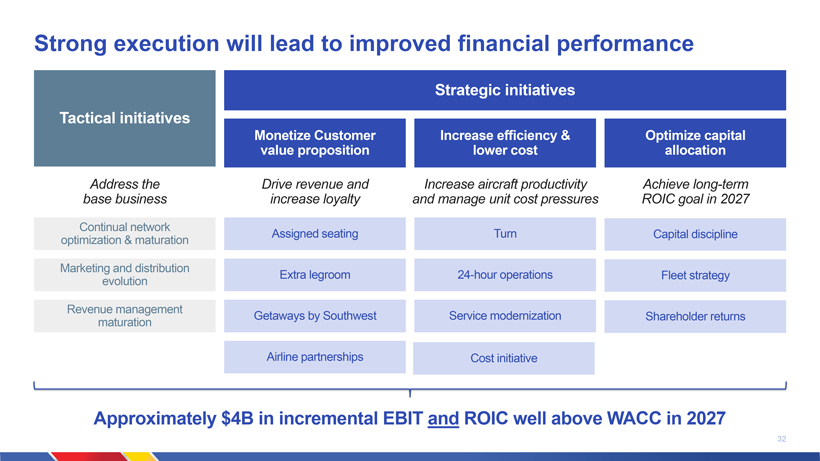
Strong execution will lead to improved financial performance Strategic initiatives Tactical initiatives Monetize Customer Increase efficiency & Optimize capital value proposition lower cost allocation Address the Drive revenue and Increase aircraft productivity Achieve long-term base business increase loyalty and manage unit cost pressures ROIC goal in 2027 Continual network Assigned seating Turn Capital discipline optimization & maturation Marketing and distribution Extra legroom 24-hour operations Fleet strategy evolution Revenue management Getaways by Southwest Service modernization Shareholder returns maturation Airline partnerships Cost initiative Approximately $4B in incremental EBIT and ROIC well above WACC in 2027 32

Our 2027 targets support strong Shareholder returns Capacity1 Operating margin Leverage 1% to 2% ≥10% Low to mid 30% Free cash flow ROIC Balance sheet Investment-grade credit >$1 billion ≥15% rating 1. As measured in year-over-year available seat miles 33
Key takeaways Strong foundation and proven business model Thoughtful transformation of our product as Customer preferences evolve An approach that is rooted in data and research Executing to drive Customer and Shareholder value Bold and achievable plan to deliver ROIC well in excess of WACC 34
Driving revenue and profitability by optimizing operations Andrew Watterson
Changing Customer behaviors
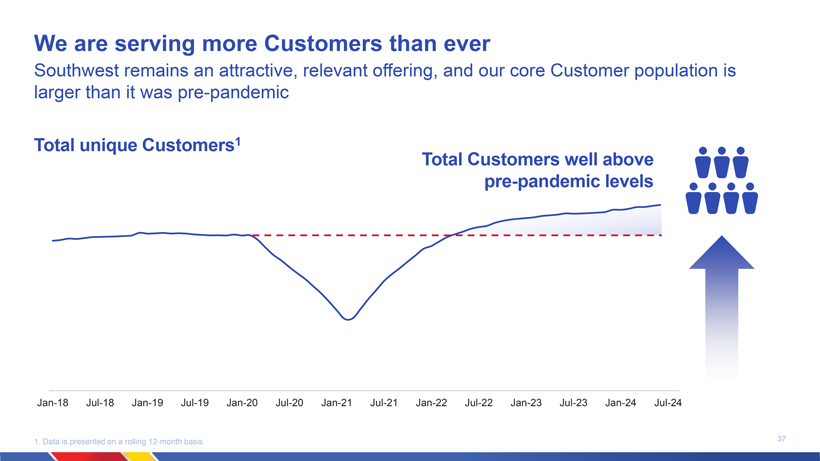
We are serving more Customers than ever Southwest remains an attractive, relevant offering, and our core Customer population is larger than it was pre-pandemic Total unique Customers1 Total Customers well above 40.0 M pre-pandemic levels 35.0 M 30.0 M 25.0 M 20.0 M 15.0 M 10.0 M 5.0 M 0.0 M Jan-18 Jul-18 Jan-19 Jul-19 Jan-20 Jul-20 Jan-21 Jul-21 Jan-22 Jul-22 Jan-23 Jul-23 Jan-24 Jul-24 1. Data is presented on a rolling 12-month basis 37
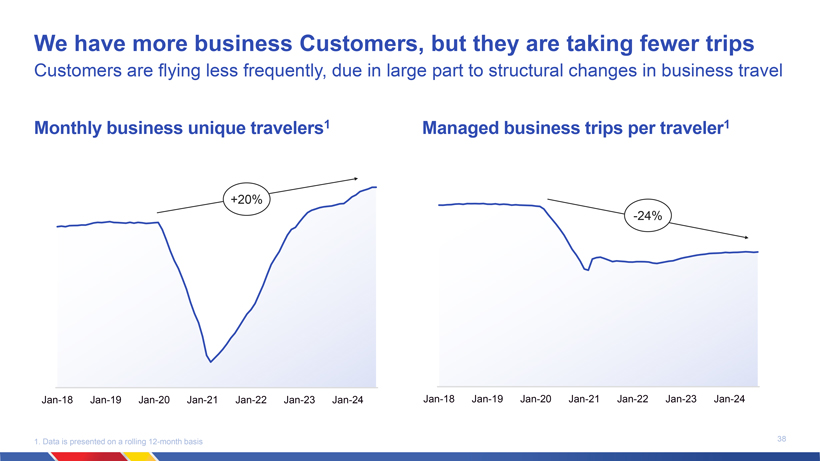
We have more business Customers, but they are taking fewer trips Customers are flying less frequently, due in large part to structural changes in business travel Monthly business unique travelers1 Managed business trips per traveler1 4.5 5.0 4.5 4.0 +20% 3.5 4.0 -24% 3.5 3.0 3.0 2.5 2.5 2.0 2.0 1.5 1.5 1.0 1.0 0.5 0.5 0.0 0.0 Jan-18 Jan-19 Jan-20 Jan-21 Jan-22 Jan-23 Jan-24 Jan-18 Jan-19 Jan-20 Jan-21 Jan-22 Jan-23 Jan-24 1. Data is presented on a rolling 12-month basis 38
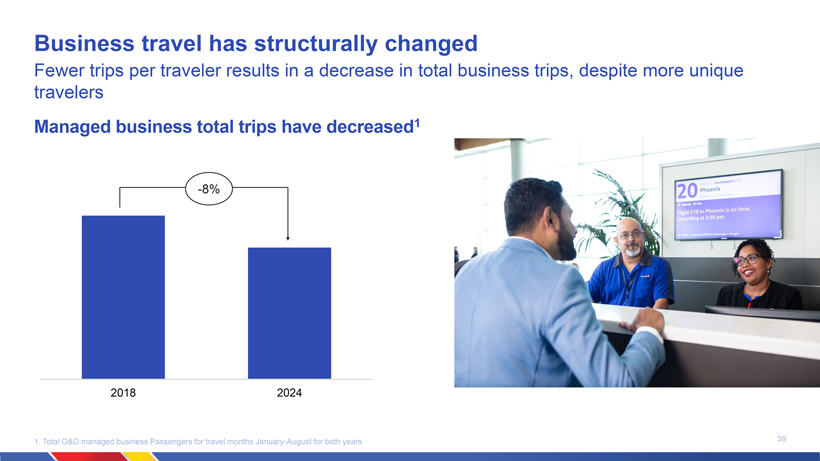
Business travel has structurally changed Fewer trips per traveler results in a decrease in total business trips, despite more unique travelers Managed business total trips have decreased1 -8% 2018 2024 1. Total O&D managed business Passengers for travel months January-August for both years 39
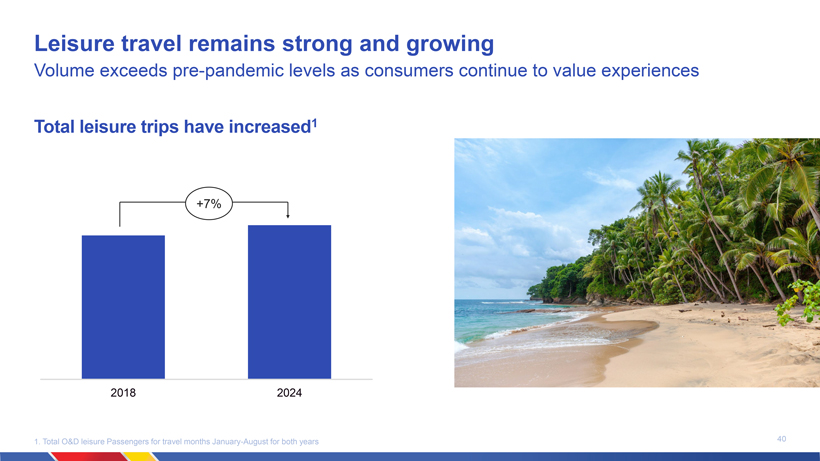
Leisure travel remains strong and growing Volume exceeds pre-pandemic levels as consumers continue to value experiences Total leisure trips have increased1 +7% 2018 2024 1. Total O&D leisure Passengers for travel months January-August for both years 40
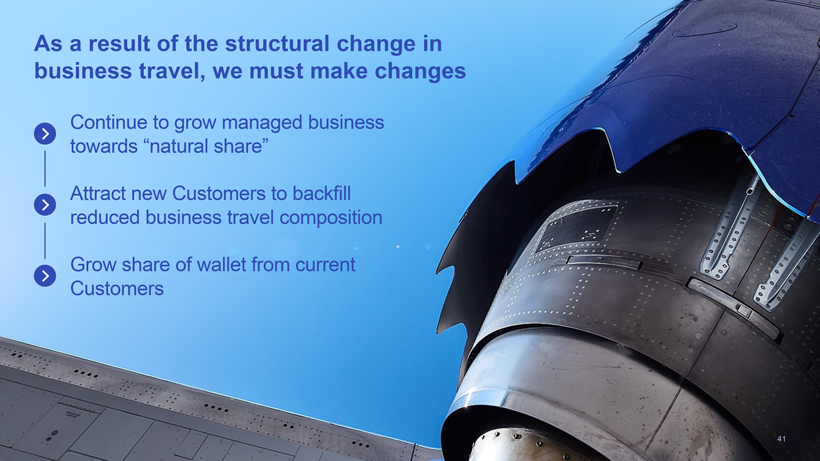
As a result of the structural change in business travel, we must make changes Continue to grow managed business towards natural share Attract new Customers to backfill reduced business travel composition Grow share of wallet from current Customers 41
Tactical initiatives to drive yield and load factor
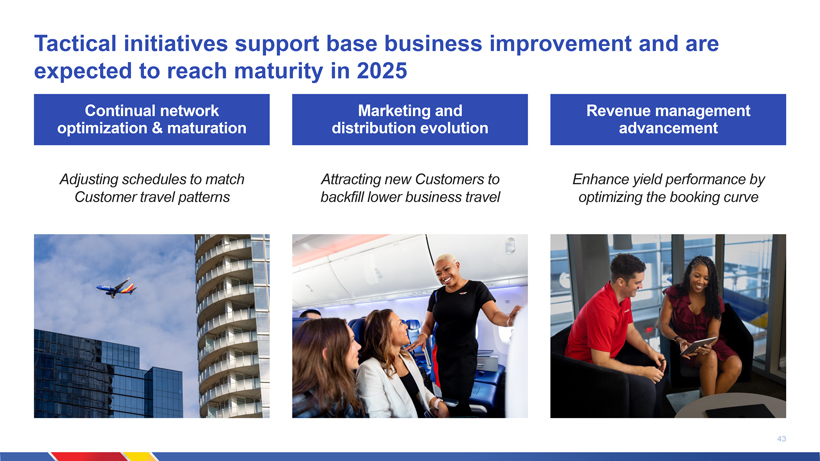
Tactical initiatives support base business improvement and are expected to reach maturity in 2025 Continual network Marketing and Revenue management optimization & maturation distribution evolution advancement Adjusting schedules to match Attracting new Customers to Enhance yield performance by Customer travel patterns backfill lower business travel optimizing the booking curve 43
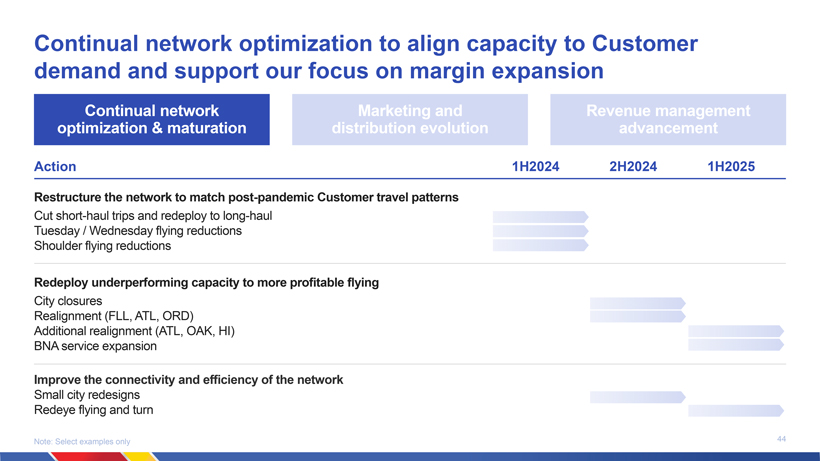
Continual network optimization to align capacity to Customer demand and support our focus on margin expansion Continual network Marketing and Revenue management optimization & maturation distribution evolution advancement Action 1H2024 2H2024 1H2025 Restructure the network to match post-pandemic Customer travel patterns Cut short-haul trips and redeploy to long-haul Tuesday / Wednesday flying reductions Shoulder flying reductions Redeploy underperforming capacity to more profitable flying City closures Realignment (FLL, ATL, ORD) Additional realignment (ATL, OAK, HI) BNA service expansion Improve the connectivity and efficiency of the network Small city redesigns Redeye flying and turn Note: Select examples only 44
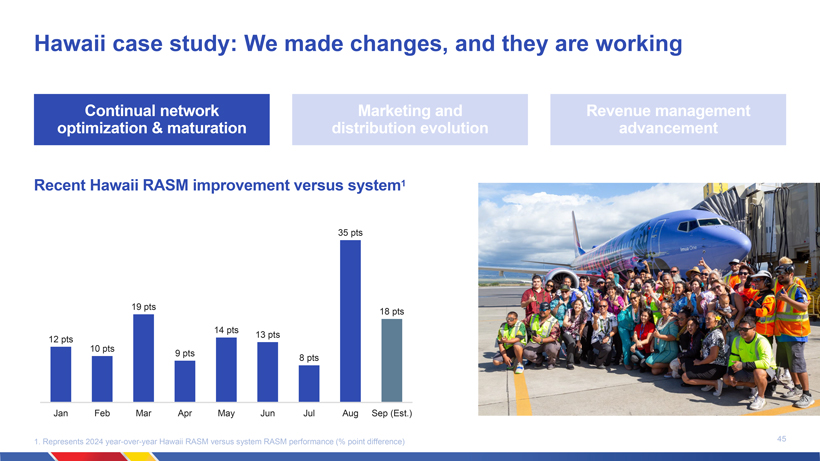
Hawaii case study: We made changes, and they are working Continual network Marketing and Revenue management optimization & maturation distribution evolution advancement Recent Hawaii RASM improvement versus system1 35 pts 19 pts 18 pts 14 pts 13 pts 12 pts 10 pts 9 pts 8 pts Jan Feb Mar Apr May Jun Jul Aug Sep (Est.) 1. Represents 2024 year-over-year Hawaii RASM versus system RASM performance (% point difference) 45
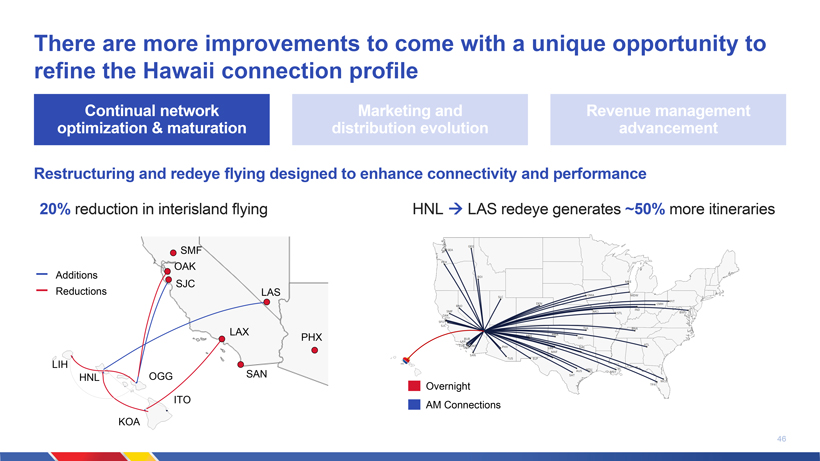
There are more improvements to come with a unique opportunity to refine the Hawaii connection profile Continual network Marketing and Revenue management optimization & maturation distribution evolution advancement Restructuring and redeye flying designed to enhance connectivity and performance 20% reduction in interisland flying HNL â LAS redeye generates ~50% more itineraries SMF Additions OAK SJC Reductions LAS LAX PHX LIH HNL OGG SAN Overnight ITO AM Connections KOA 46
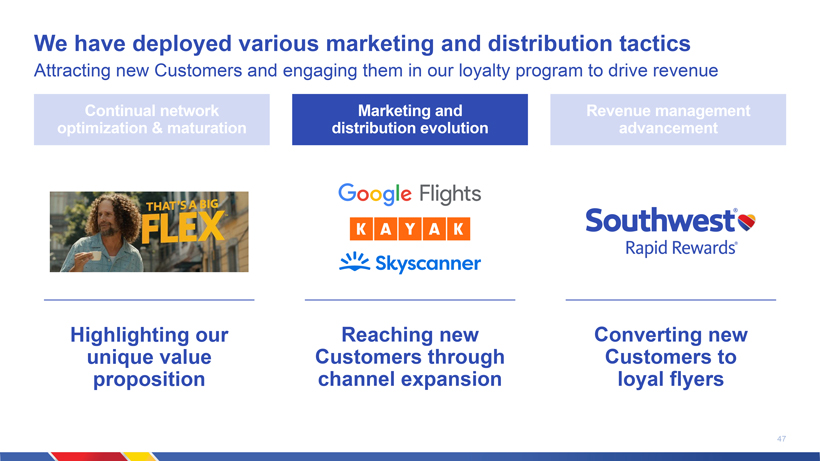
We have deployed various marketing and distribution tactics Attracting new Customers and engaging them in our loyalty program to drive revenue Continual network Marketing and Revenue management optimization & maturation distribution evolution advancement Highlighting our Reaching new Converting new unique value Customers through Customers to proposition channel expansion loyal flyers 47
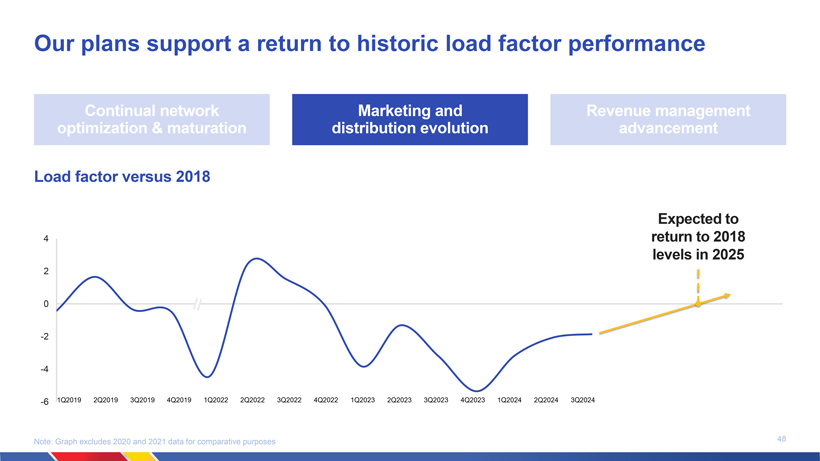
Our plans support a return to historic load factor performance Continual network Marketing and Revenue management optimization & maturation distribution evolution advancement Load factor versus 2018 Expected to 4 return to 2018 levels in 2025 2 0 -2 -4 -6 1Q2019 2Q2019 3Q2019 4Q2019 1Q2022 2Q2022 3Q2022 4Q2022 1Q2023 2Q2023 3Q2023 4Q2023 1Q2024 2Q2024 3Q2024 Note: Graph excludes 2020 and 2021 data for comparative purposes 48
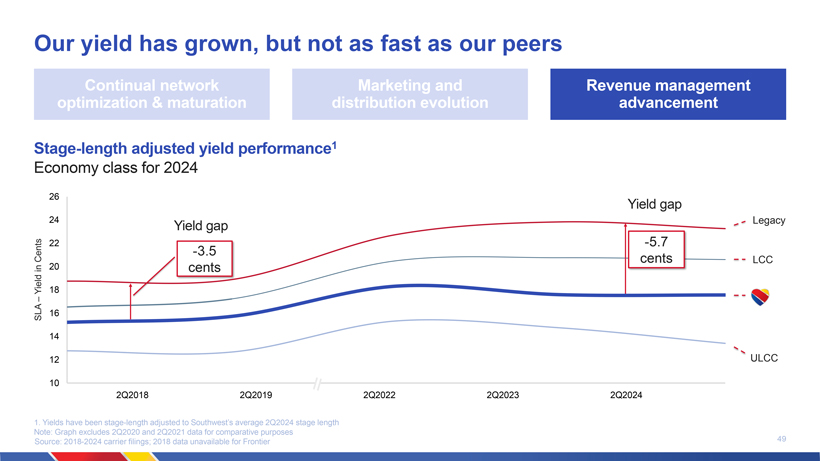
Our yield has grown, but not as fast as our peers Continual network Marketing and Revenue management optimization & maturation distribution evolution advancement Stage-length adjusted yield performance1 Economy class for 2024 26 Yield gap 24 Yield gap Legacy 22 -5.7 Cents -3.5 cents LCC in 20 cents Yield 18 SLA 16 14 12 ULCC 10 2Q2018 2Q2019 2Q2022 2Q2023 2Q2024 1. Yields have been stage-length adjusted to Southwests average 2Q2024 stage length Note: Graph excludes 2Q2020 and 2Q2021 data for comparative purposes 49 Source: 2018-2024 carrier filings; 2018 data unavailable for Frontier
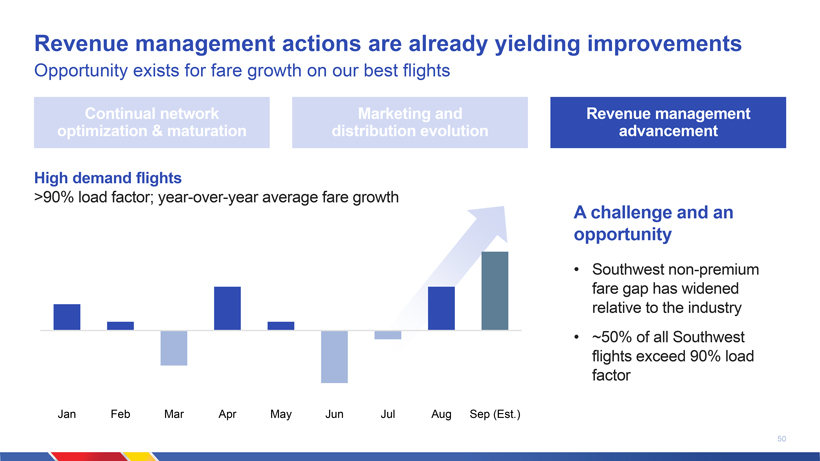
Revenue management actions are already yielding improvements Opportunity exists for fare growth on our best flights Continual network Marketing and Revenue management optimization & maturation distribution evolution advancement High demand flights >90% load factor; year-over-year average fare growth A challenge and an opportunity Southwest non-premium fare gap has widened relative to the industry ~50% of all Southwest flights exceed 90% load factor Jan Feb Mar Apr May Jun Jul Aug Sep (Est.) 50
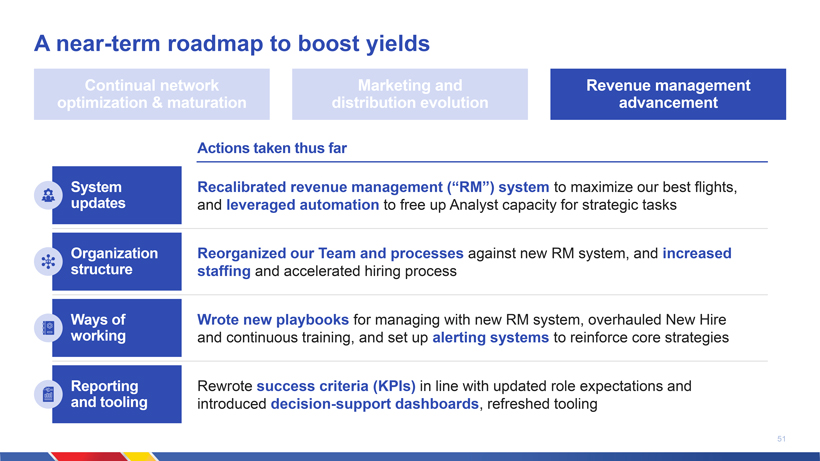
A near-term roadmap to boost yields Continual network Marketing and Revenue management optimization & maturation distribution evolution advancement Actions taken thus far System Recalibrated revenue management (RM) system to maximize our best flights, updates and leveraged automation to free up Analyst capacity for strategic tasks Organization Reorganized our Team and processes against new RM system, and increased structure staffing and accelerated hiring process Ways of Wrote new playbooks for managing with new RM system, overhauled New Hire working and continuous training, and set up alerting systems to reinforce core strategies Reporting Rewrote success criteria (KPIs) in line with updated role expectations and and tooling introduced decision-support dashboards, refreshed tooling 51
Actions to enhance operating efficiency
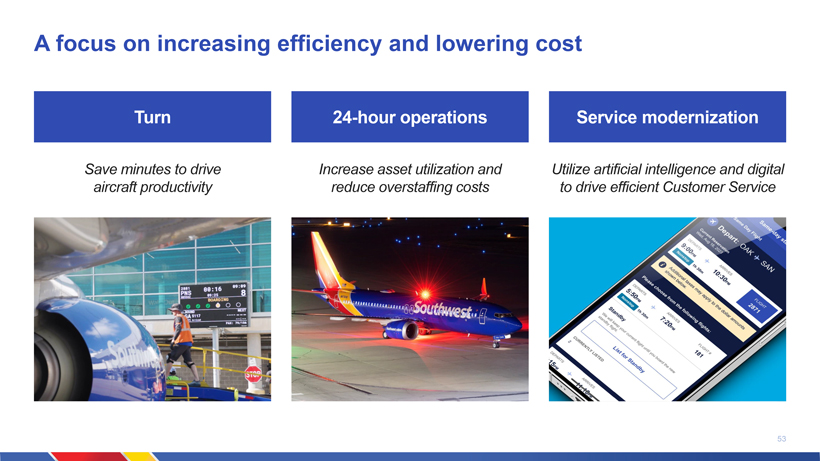
A focus on increasing efficiency and lowering cost Turn 24-hour operations Service modernization Save minutes to drive Increase asset utilization and Utilize artificial intelligence and digital aircraft productivity reduce overstaffing costs to drive efficient Customer Service 53
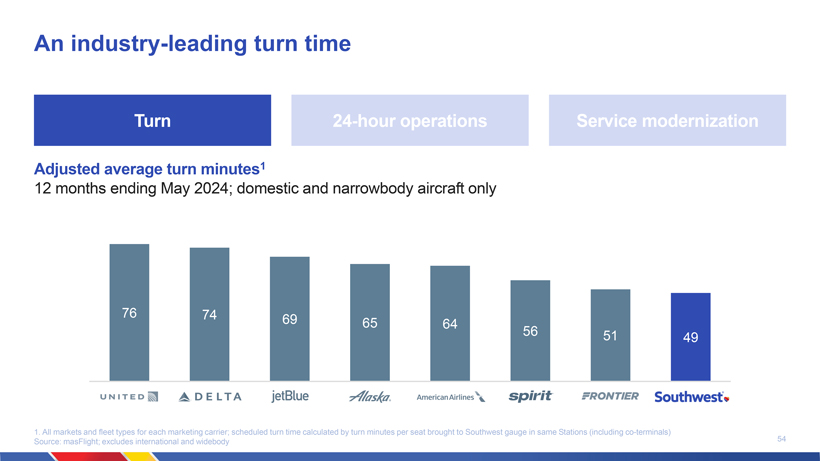
An industry-leading turn time Turn 24-hour operations Service modernization Adjusted average turn minutes1 12 months ending May 2024; domestic and narrowbody aircraft only 76 74 69 65 64 56 51 49 1. All markets and fleet types for each marketing carrier; scheduled turn time calculated by turn minutes per seat brought to Southwest gauge in same Stations (including co-terminals) 54 Source: masFlight; excludes international and widebody
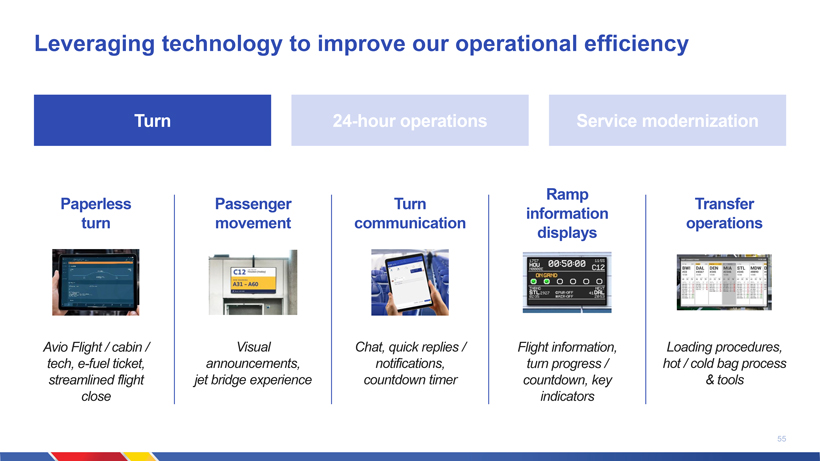
Leveraging technology to improve our operational efficiency Turn 24-hour operations Service modernization Ramp Paperless Passenger Turn Transfer information turn movement communication operations displays Avio Flight / cabin / Visual Chat, quick replies / Flight information, Loading procedures, tech, e-fuel ticket, announcements, notifications, turn progress / hot / cold bag process streamlined flight jet bridge experience countdown timer countdown, key & tools close indicators 55
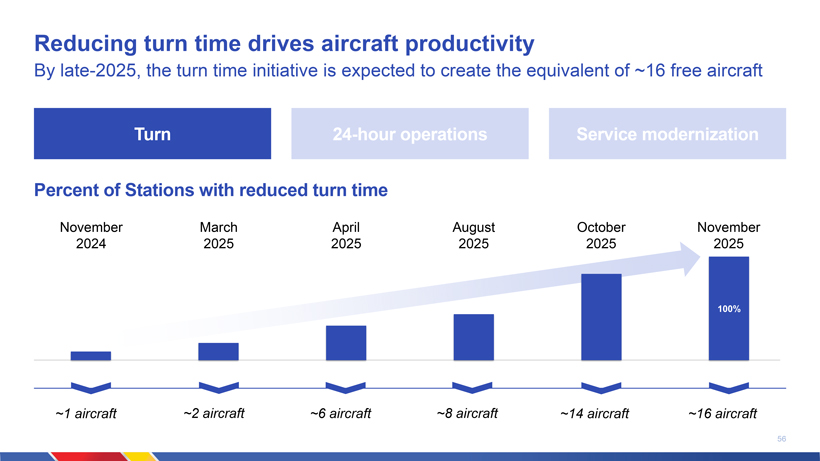
Reducing turn time drives aircraft productivity By late-2025, the turn time initiative is expected to create the equivalent of ~16 free aircraft Turn 24-hour operations Service modernization Percent of Stations with reduced turn time November March April August October November 2024 2025 2025 2025 2025 2025 100% ~1 aircraft ~2 aircraft ~6 aircraft ~8 aircraft ~14 aircraft ~16 aircraft 56
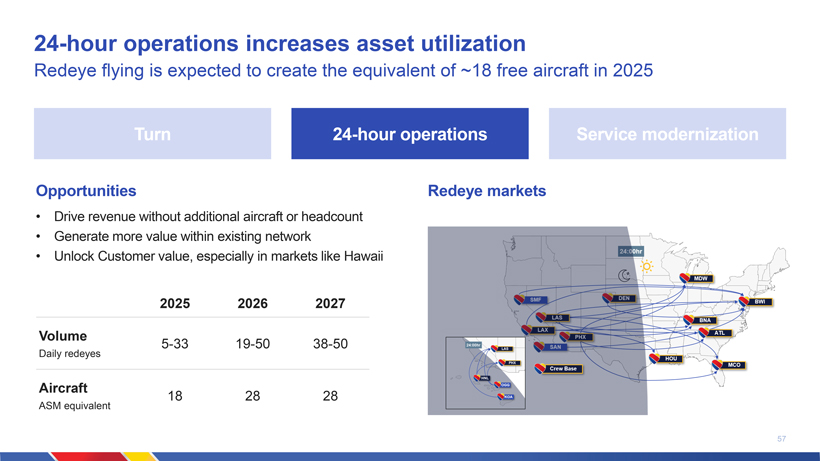
24-hour operations increases asset utilization Redeye flying is expected to create the equivalent of ~18 free aircraft in 2025 Turn 24-hour operations Service modernization Opportunities Redeye markets Drive revenue without additional aircraft or headcount Generate more value within existing network Unlock Customer value, especially in markets like Hawaii 2025 2026 2027 Volume 5-33 19-50 38-50 Daily redeyes Aircraft 18 28 28 ASM equivalent 57
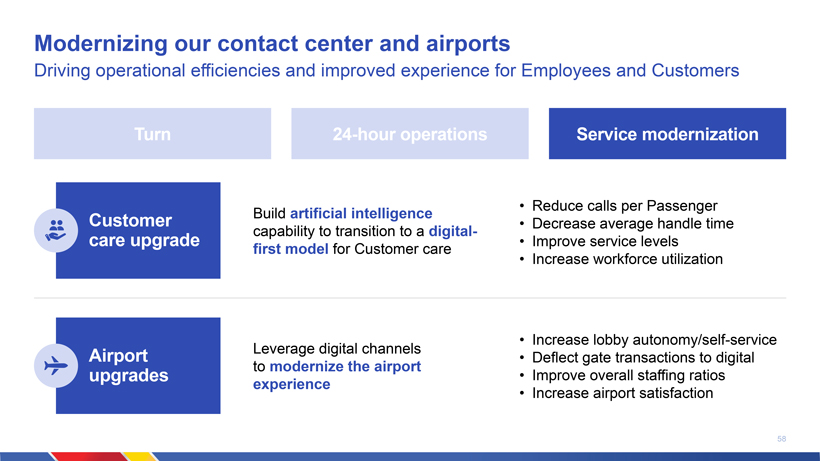
Modernizing our contact center and airports Driving operational efficiencies and improved experience for Employees and Customers Turn 24-hour operations Service modernization Reduce calls per Passenger Customer Build artificial intelligence Decrease average handle time capability to transition to a digital-care upgrade Improve service levels first model for Customer care Increase workforce utilization Increase lobby autonomy/self-service Airport Leverage digital channels Deflect gate transactions to digital to modernize the airport upgrades Improve overall staffing ratios experience Increase airport satisfaction 58
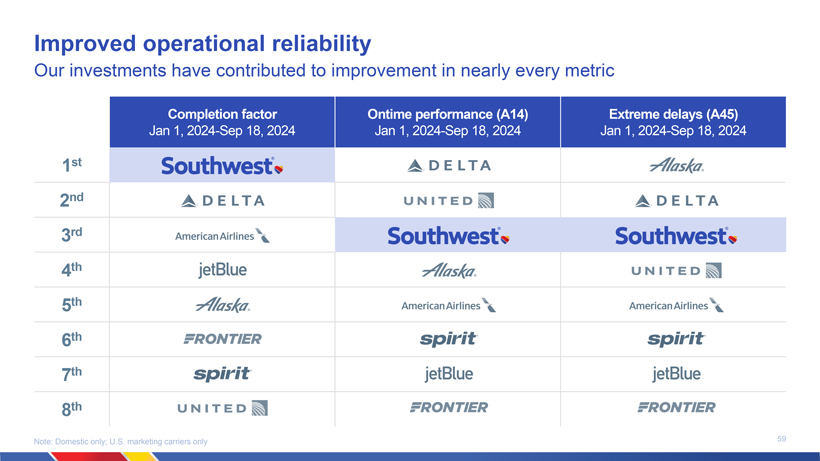
Improved operational reliability Our investments have contributed to improvement in nearly every metric Completion factor Ontime performance (A14) Extreme delays (A45) Jan 1, 2024-Sep 18, 2024 Jan 1, 2024-Sep 18, 2024 Jan 1, 2024-Sep 18, 2024 1st 2nd 3rd 4th 5th 6th 7th 8th Note: Domestic only; U.S. marketing carriers only 59
Key takeaways Structural changes in travel behavior require us to adjust The plan addresses both revenue and efficiency opportunities Tactical actions underway are already providing benefits Operational reliability improvements demonstrate our ability to execute 60
Transforming our Customer value proposition Ryan Green
Shaping our transformation
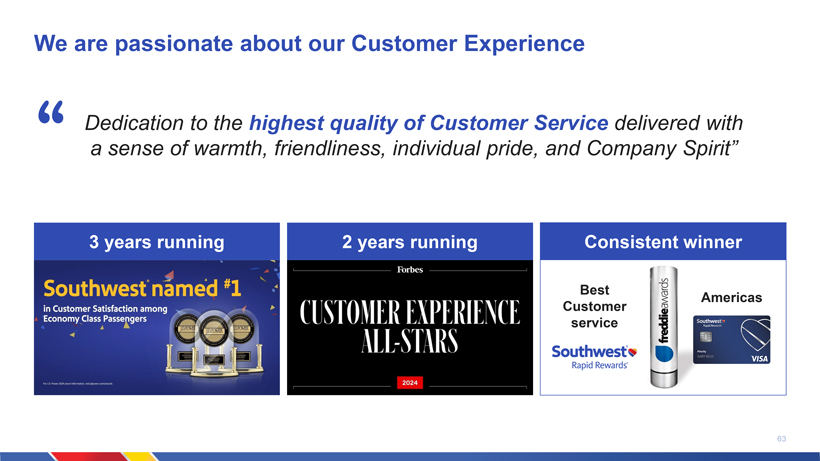
We are passionate about our Customer Experience Dedication to the highest quality of Customer Service delivered with a sense of warmth, friendliness, individual pride, and Company Spirit 3 years running 2 years running Consistent winner Best Americas Customer service 63
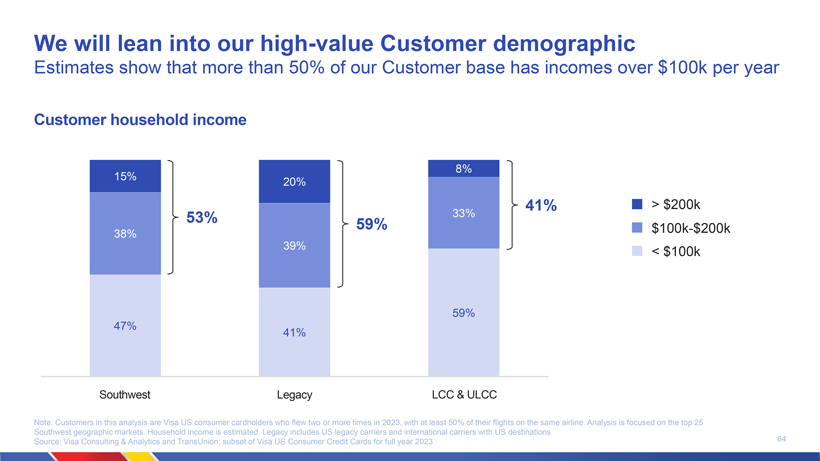
We will lean into our high-value Customer demographic Estimates show that more than 50% of our Customer base has incomes over $100k per year Customer household income 8% 15% 20% 41% > $200k 53% 33% 59% $100k-$200k 38% 39% < $100k 59% 47% 41% Southwest Legacy LCC & ULCC Note: Customers in this analysis are Visa US consumer cardholders who flew two or more times in 2023, with at least 50% of their flights on the same airline. Analysis is focused on the top 25 Southwest geographic markets. Household income is estimated. Legacy includes US legacy carriers and international carriers with US destinations 64 Source: Visa Consulting & Analytics and TransUnion; subset of Visa US Consumer Credit Cards for full year 2023
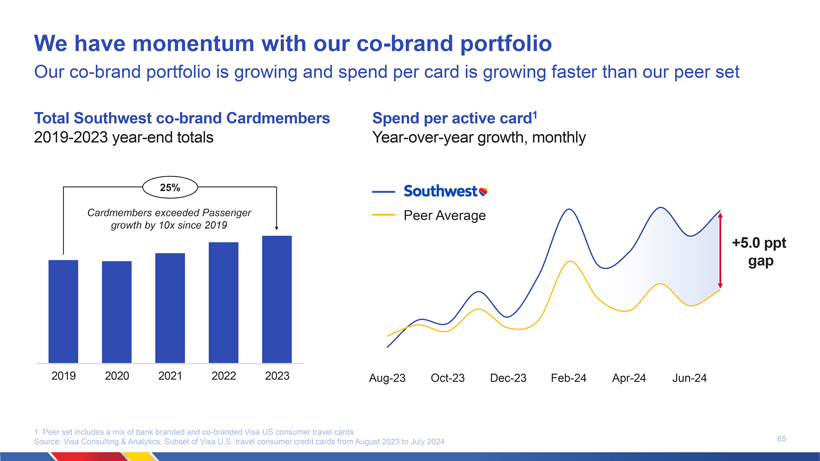
We have momentum with our co-brand portfolio Our co-brand portfolio is growing and spend per card is growing faster than our peer set Total Southwest co-brand Cardmembers Spend per active card1 2019-2023 year-end totals Year-over-year growth, monthly 25% Cardmembers exceeded Passenger growth by 10x since 2019 +5.0 ppt gap 2019 2020 2021 2022 2023 Aug-23 Oct-23 Dec-23 Feb-24 Apr-24 Jun-24 1. Peer set includes a mix of bank branded and co-branded Visa US consumer travel cards 65 Source: Visa Consulting & Analytics; Subset of Visa U.S. travel consumer credit cards from August 2023 to July 2024
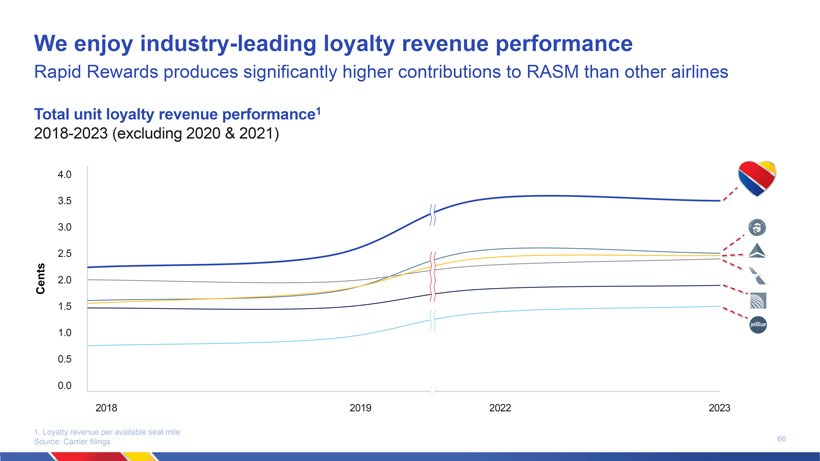
We enjoy industry-leading loyalty revenue performance Rapid Rewards produces significantly higher contributions to RASM than other airlines Total unit loyalty revenue performance1 2018-2023 (excluding 2020 & 2021) 4.0 3.5 3.0 2.5 Cents 2.0 1.5 1.0 0.5 0.0 2018 2019 2022 2023 1. Loyalty revenue per available seat mile 66 Source: Carrier filings
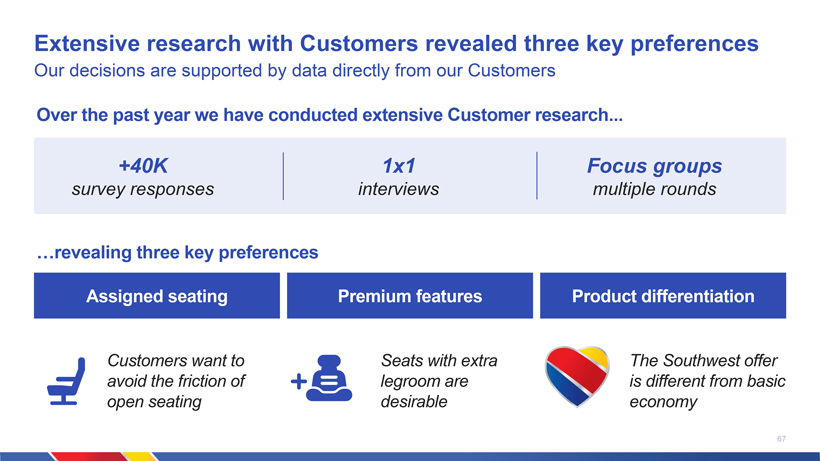
Extensive research with Customers revealed three key preferences Our decisions are supported by data directly from our Customers Over the past year we have conducted extensive Customer research +40K 1x1 Focus groups survey responses interviews multiple rounds revealing three key preferences Assigned seating Premium features Product differentiation Customers want to Seats with extra The Southwest offer avoid the friction of legroom are is different from basic open seating desirable economy 67
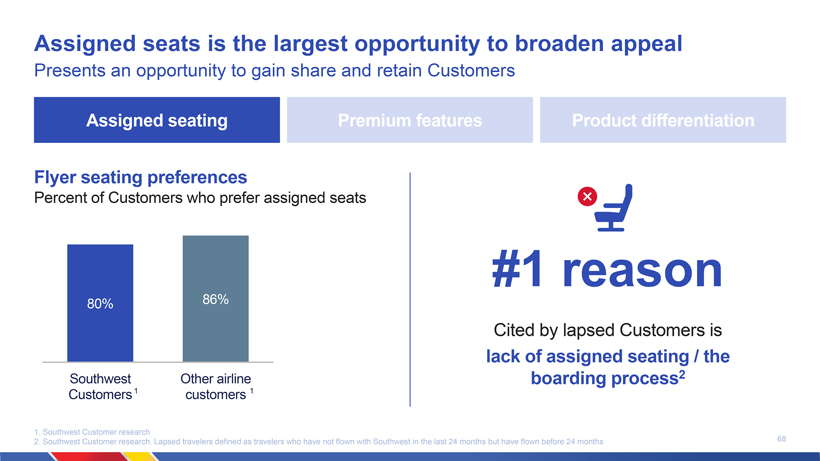
Assigned seats is the largest opportunity to broaden appeal Presents an opportunity to gain share and retain Customers Assigned seating Premium features Product differentiation Flyer seating preferences Percent of Customers who prefer assigned seats #1 reason 80% 86% Cited by lapsed Customers is lack of assigned seating / the Southwest Other airline boarding process2 Customers1 customers 1 1. Southwest Customer research 68 2. Southwest Customer research. Lapsed travelers defined as travelers who have not flown with Southwest in the last 24 months but have flown before 24 months
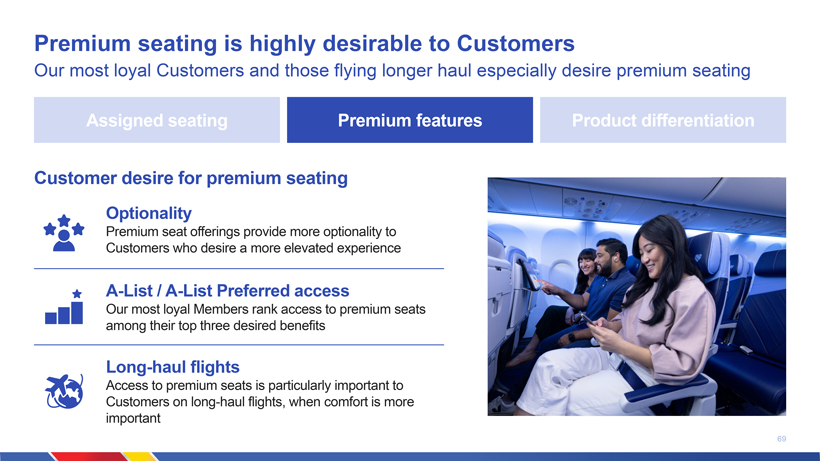
Premium seating is highly desirable to Customers Our most loyal Customers and those flying longer haul especially desire premium seating Assigned seating Premium features Product differentiation Customer desire for premium seating Optionality Premium seat offerings provide more optionality to Customers who desire a more elevated experience A-List / A-List Preferred access Our most loyal Members rank access to premium seats among their top three desired benefits Long-haul flights Access to premium seats is particularly important to Customers on long-haul flights, when comfort is more important 69
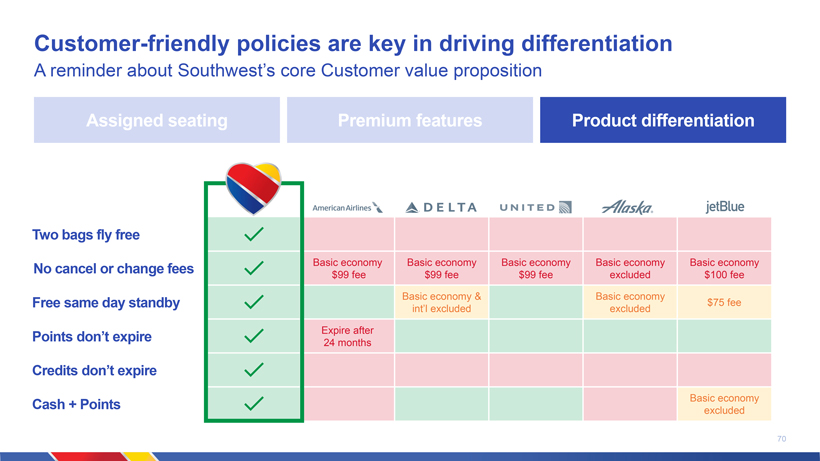
Customer-friendly policies are key in driving differentiation A reminder about Southwests core Customer value proposition Assigned seating Premium features Product differentiation Two bags fly free No cancel or change fees Basic economy Basic economy Basic economy Basic economy Basic economy $99 fee $99 fee $99 fee excluded $100 fee Basic economy & Basic economy Free same day standby $75 fee intl excluded excluded Points dont expire Expire after 24 months Credits dont expire Cash + Points Basic economy excluded 70
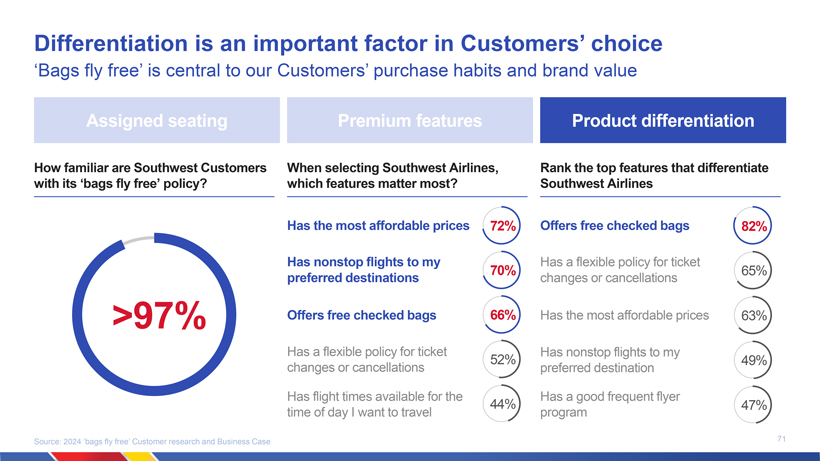
Differentiation is an important factor in Customers choice Bags fly free is central to our Customers purchase habits and brand value Assigned seating Premium features Product differentiation How familiar are Southwest Customers When selecting Southwest Airlines, Rank the top features that differentiate with its bags fly free policy? which features matter most? Southwest Airlines Has the most affordable prices 72% Offers free checked bags 82% Has nonstop flights to my Has a flexible policy for ticket 70% 65% preferred destinations changes or cancellations >97% Offers free checked bags 66% Has the most affordable prices 63% Has a flexible policy for ticket Has nonstop flights to my 52% 49% changes or cancellations preferred destination Has flight times available for the Has a good frequent flyer 44% 47% time of day I want to travel program Source: 2024 bags fly free Customer research and Business Case 71
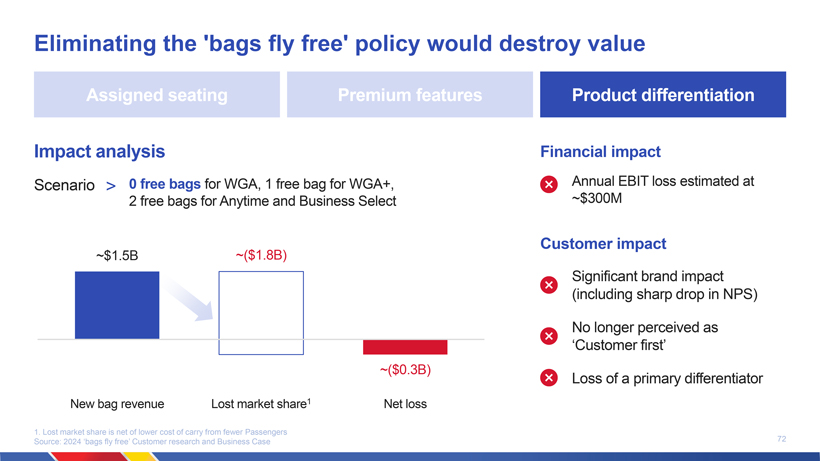
Eliminating the bags fly free policy would destroy value Assigned seating Premium features Product differentiation Impact analysis Financial impact Scenario > 0 free bags for WGA, 1 free bag for WGA+, Annual EBIT loss estimated at 2 free bags for Anytime and Business Select ~$300M Customer impact ~$1.5B ~($1.8B) Significant brand impact (including sharp drop in NPS) No longer perceived as Customer first ~($0.3B) Loss of a primary differentiator New bag revenue Lost market share1 Net loss 1. Lost market share is net of lower cost of carry from fewer Passengers 72 Source: 2024 bags fly free Customer research and Business Case
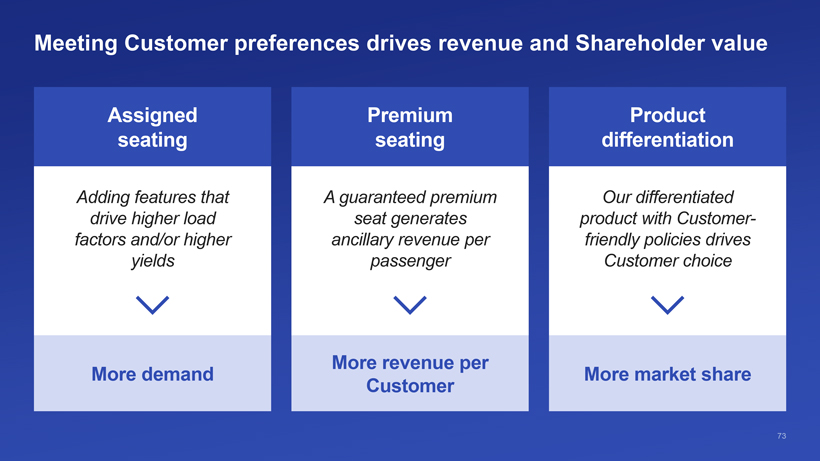
Meeting Customer preferences drives revenue and Shareholder value Assigned Premium Product seating seating differentiation Adding features that A guaranteed premium Our differentiated drive higher load seat generates product with Customer-factors and/or higher ancillary revenue per friendly policies drives yields passenger Customer choice More revenue per More demand More market share Customer 73
Reimagining our core product
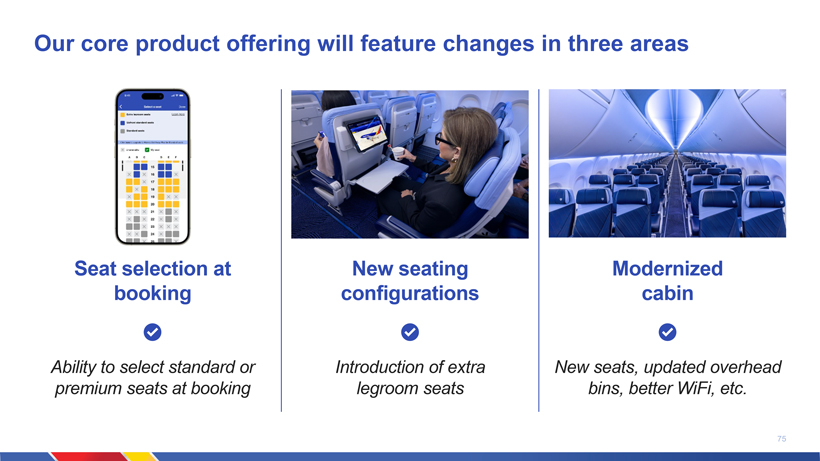
Our core product offering will feature changes in three areas Seat selection at New seating Modernized booking configurations cabin Ability to select standard or Introduction of extra New seats, updated overhead premium seats at booking legroom seats bins, better WiFi, etc. 75
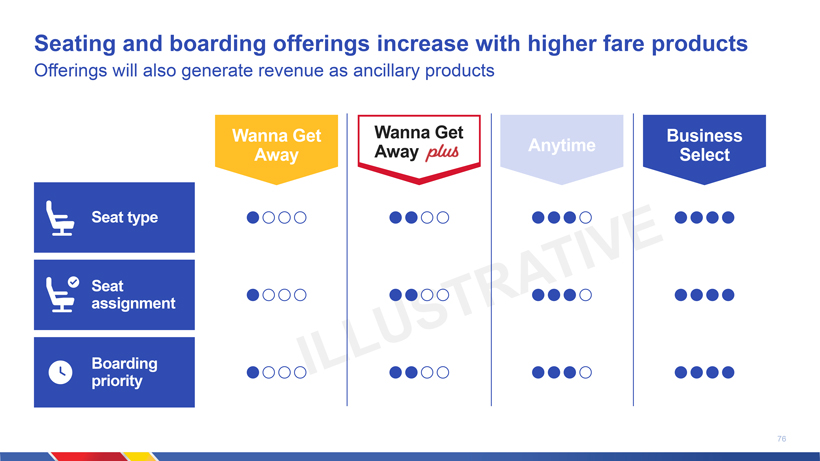
Seating and boarding offerings increase with higher fare products Offerings will also generate revenue as ancillary products Wanna Get Wanna Get Business Away Anytime Away Select Seat type Seat assignment Boarding priority 76
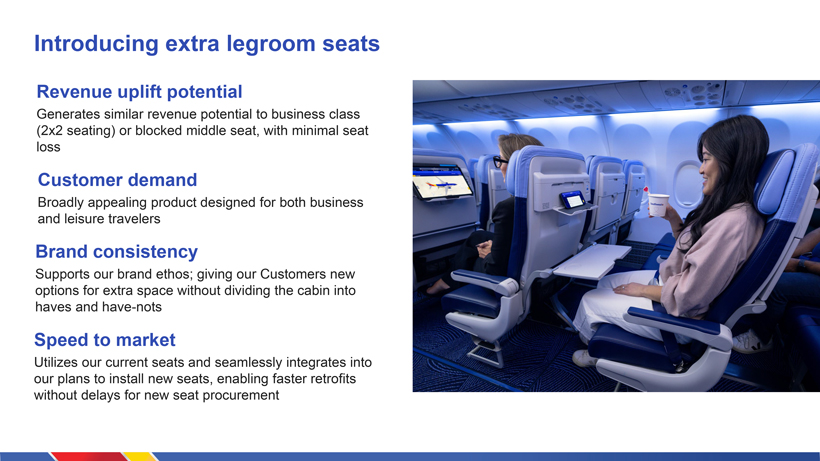
Introducing extra legroom seats Revenue uplift potential Generates similar revenue potential to business class (2x2 seating) or blocked middle seat, with minimal seat loss Customer demand Broadly appealing product designed for both business and leisure travelers Brand consistency Supports our brand ethos; giving our Customers new options for extra space without dividing the cabin into haves and have-nots Speed to market Utilizes our current seats and seamlessly integrates into our plans to install new seats, enabling faster retrofits without delays for new seat procurement 77
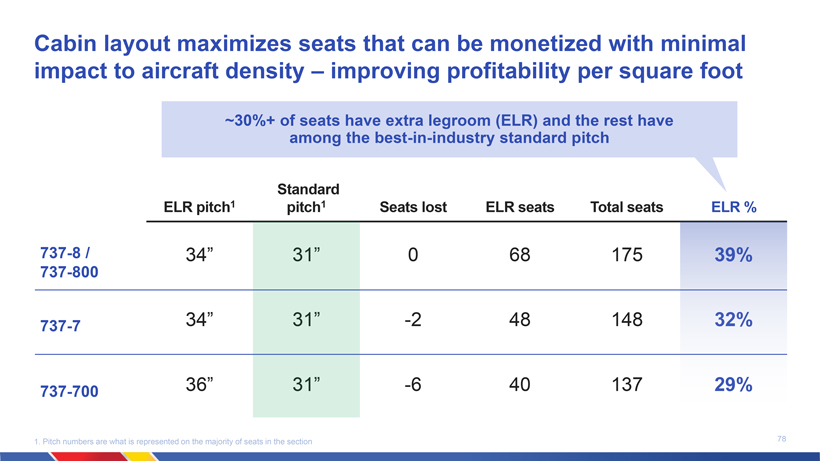
Cabin layout maximizes seats that can be monetized with minimal impact to aircraft density improving profitability per square foot ~30%+ of seats have extra legroom (ELR) and the rest have among the best-in-industry standard pitch Standard ELR pitch1 pitch1 Seats lost ELR seats Total seats ELR % 737-8 / 34 0 68 175 737-800 737-7 34 -2 48 148 737-700 36 -6 40 137 1. Pitch numbers are what is represented on the majority of seats in the section 78
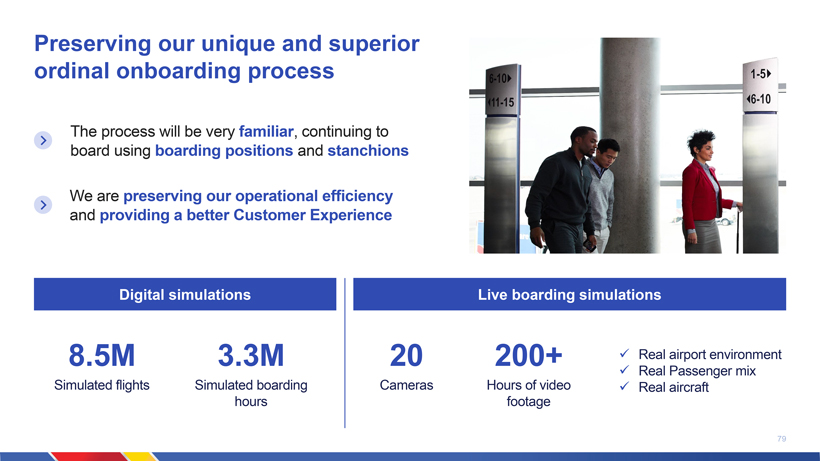
Preserving our unique and superior ordinal onboarding process The process will be very familiar, continuing to board using boarding positions and stanchions We are preserving our operational efficiency and providing a better Customer Experience Digital simulations Live boarding simulations 8.5M 3.3M 20 200+ ✓ Real airport environment ✓ Real Passenger mix Simulated flights Simulated boarding Cameras Hours of video ✓ Real aircraft hours footage 79
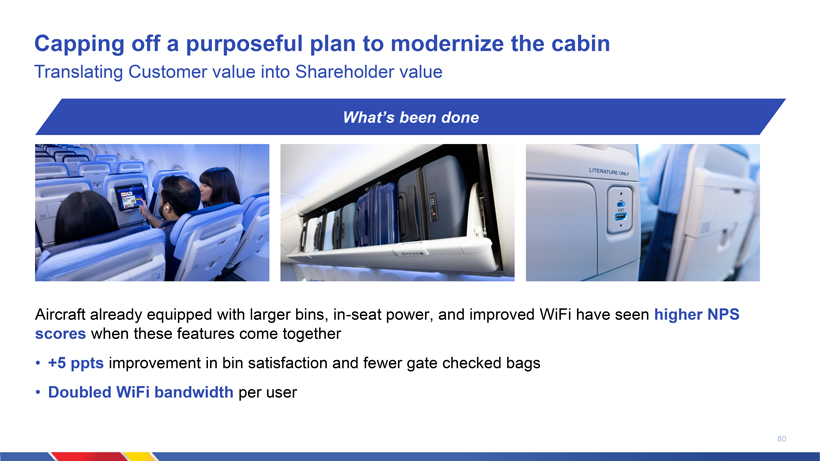
Capping off a purposeful plan to modernize the cabin Translating Customer value into Shareholder value Whats been done Aircraft already equipped with larger bins, in-seat power, and improved WiFi have seen higher NPS scores when these features come together +5 ppts improvement in bin satisfaction and fewer gate checked bags Doubled WiFi bandwidth per user 80
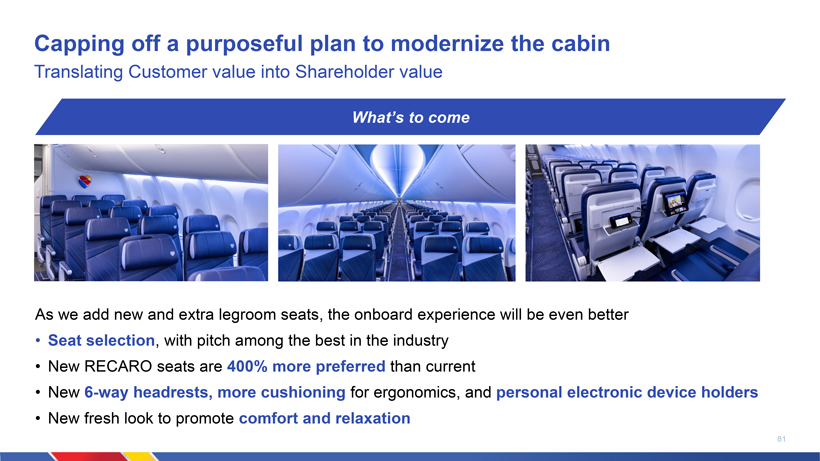
Capping off a purposeful plan to modernize the cabin Translating Customer value into Shareholder value Whats to come As we add new and extra legroom seats, the onboard experience will be even better Seat selection, with pitch among the best in the industry New RECARO seats are 400% more preferred than current New 6-way headrests, more cushioning for ergonomics, and personal electronic device holders New fresh look to promote comfort and relaxation 81
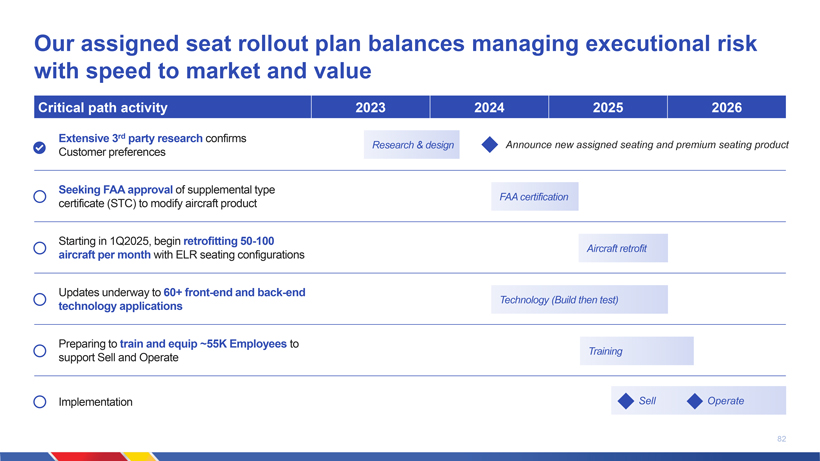
Our assigned seat rollout plan balances managing executional risk with speed to market and value Critical path activity 2023 2024 2025 2026 Extensive 3rd party research confirms Research & design Announce new assigned seating and premium seating product Customer preferences Seeking FAA approval of supplemental type FAA certification certificate (STC) to modify aircraft product Starting in 1Q2025, begin retrofitting 50-100 Aircraft retrofit aircraft per month with ELR seating configurations Updates underway to 60+ front-end and back-end Technology (Build then test) technology applications Preparing to train and equip ~55K Employees to Training support Sell and Operate Implementation Sell Operate 82
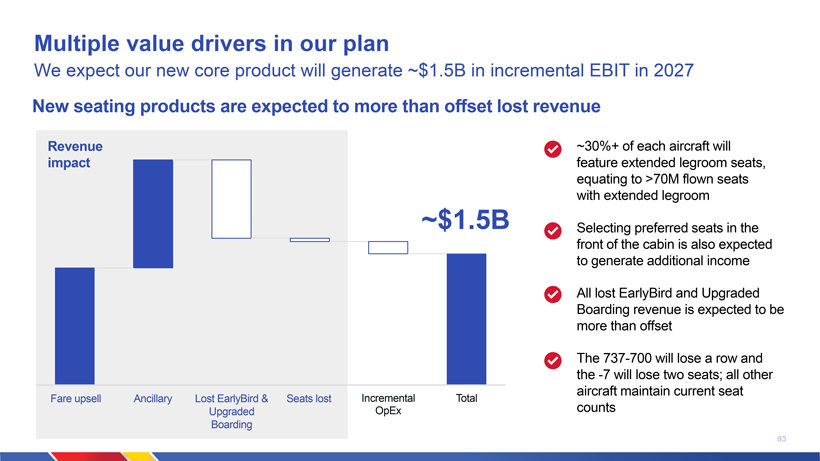
Multiple value drivers in our plan We expect our new core product will generate ~$1.5B in incremental EBIT in 2027 New seating products are expected to more than offset lost revenue Revenue ~30%+ of each aircraft will impact feature extended legroom seats, equating to >70M flown seats with extended legroom ~$1.5B Selecting preferred seats in the front of the cabin is also expected to generate additional income All lost EarlyBird and Upgraded Boarding revenue is expected to be more than offset The 737-700 will lose a row and the -7 will lose two seats; all other aircraft maintain current seat Fare upsell Ancillary Lost EarlyBird & Seats lost Incremental Total Upgraded OpEx counts Boarding 83
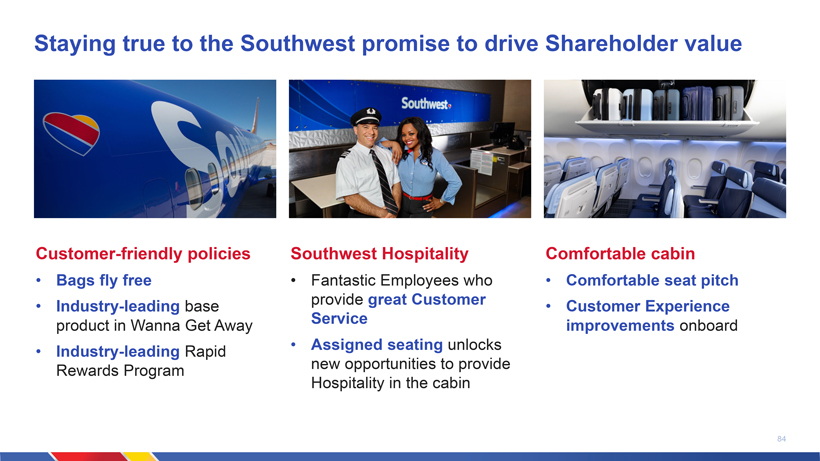
Staying true to the Southwest promise to drive Shareholder value Customer-friendly policies Southwest Hospitality Comfortable cabin Bags fly free Fantastic Employees who Comfortable seat pitch Industry-leading base provide great Customer Customer Experience product in Wanna Get Away Service improvements onboard Industry-leading Rapid Assigned seating unlocks Rewards Program new opportunities to provide Hospitality in the cabin 84
Extending our value proposition beyond the core product
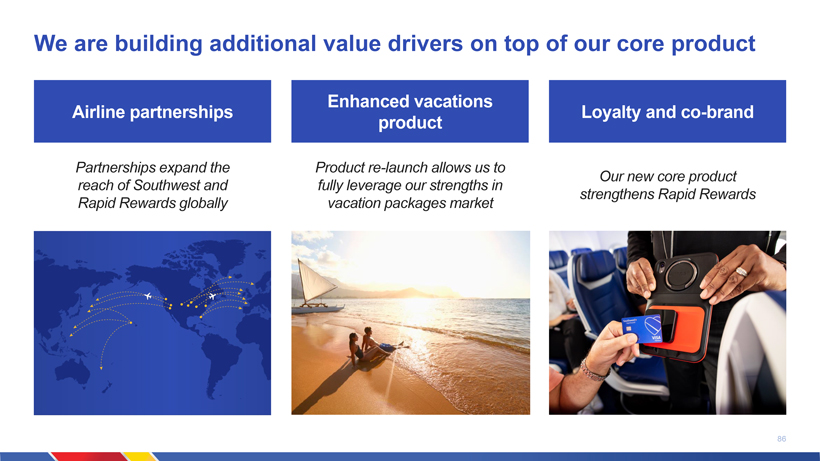
We are building additional value drivers on top of our core product Enhanced vacations Airline partnerships Loyalty and co-brand product Partnerships expand the Product re-launch allows us to Our new core product reach of Southwest and fully leverage our strengths in strengthens Rapid Rewards Rapid Rewards globally vacation packages market 86
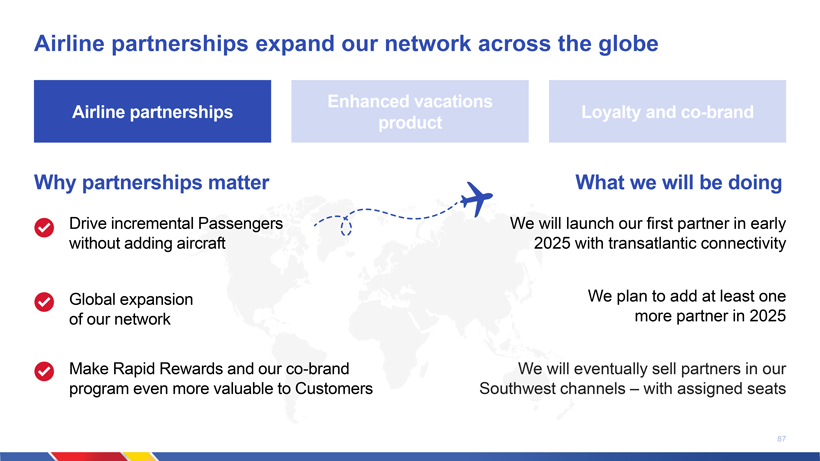
Airline partnerships expand our network across the globe Enhanced vacations Airline partnerships Loyalty and co-brand product Why partnerships matter What we will be doing Drive incremental Passengers We will launch our first partner in early without adding aircraft 2025 with transatlantic connectivity Global expansion We plan to add at least one of our network more partner in 2025 Make Rapid Rewards and our co-brand We will eventually sell partners in our program even more valuable to Customers Southwest channels with assigned seats 87
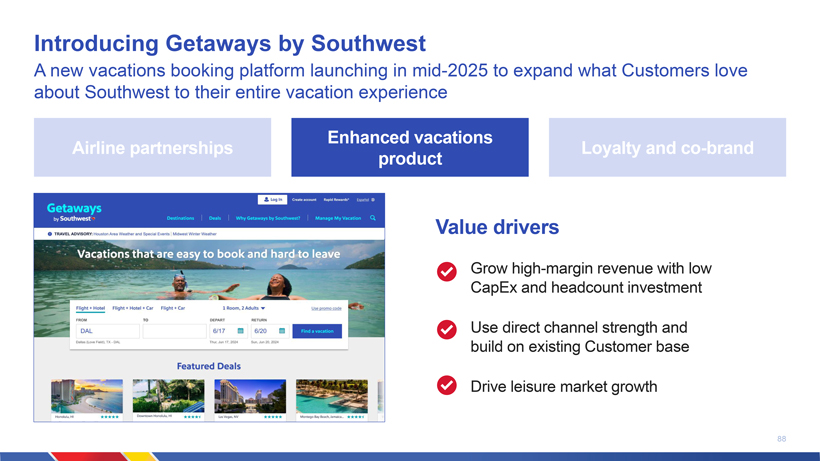
Introducing Getaways by Southwest A new vacations booking platform launching in mid-2025 to expand what Customers love about Southwest to their entire vacation experience Enhanced vacations Airline partnerships Loyalty and co-brand product Value drivers Grow high-margin revenue with low CapEx and headcount investment Use direct channel strength and build on existing Customer base Drive leisure market growth 88
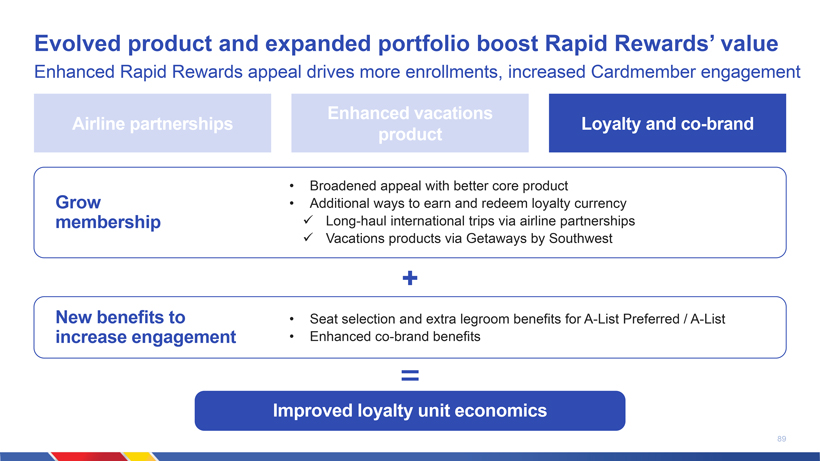
Evolved product and expanded portfolio boost Rapid Rewards value Enhanced Rapid Rewards appeal drives more enrollments, increased Cardmember engagement Enhanced vacations Airline partnerships Loyalty and co-brand product Broadened appeal with better core product Grow Additional ways to earn and redeem loyalty currency membership ✓ Long-haul international trips via airline partnerships ✓ Vacations products via Getaways by Southwest New benefits to Seat selection and extra legroom benefits for A-List Preferred / A-List increase engagement Enhanced co-brand benefits Improved loyalty unit economics 89
Key takeaways Customers want new products, and we will meet their needs We are building additional value drivers on top of our core product Changes will be made in a uniquely Southwest way The plan supports significant economic value creation 90
Transforming for sustainable profitability and Shareholder returns Tammy Romo
pBuilding on a strong financial foundation
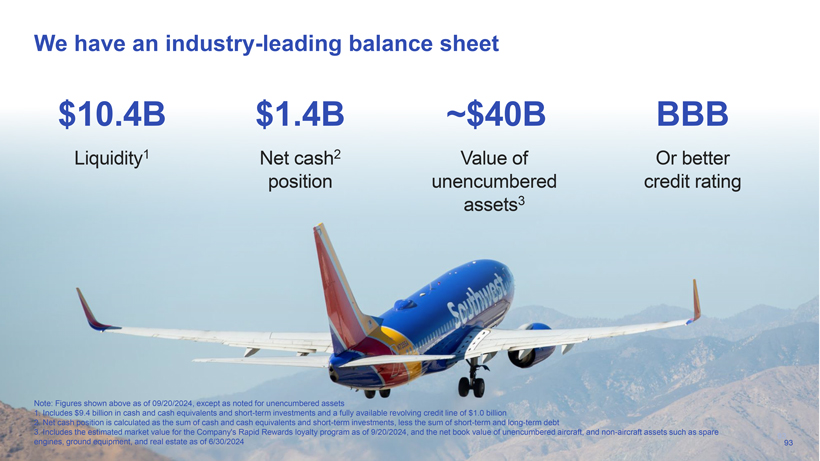
We have an industry-leading balance sheet $10.4B $1.4B ~$40B BBB Liquidity1 Net cash2 Value of Or better position unencumbered credit rating assets3 Note: Figures shown above as of 09/20/2024, except as noted for unencumbered assets 1. Includes $9.4 billion in cash and cash equivalents and short-term investments and a fully available revolving credit line of $1.0 billion 2. Net cash position is calculated as the sum of cash and cash equivalents and short-term investments, less the sum of short-term and long-term debt 3. Includes the estimated market value for the Companys Rapid Rewards loyalty program as of 9/20/2024, and the net book value of unencumbered aircraft, and non-aircraft assets such as spare 93 engines, ground equipment, and real estate as of 6/30/2024 93
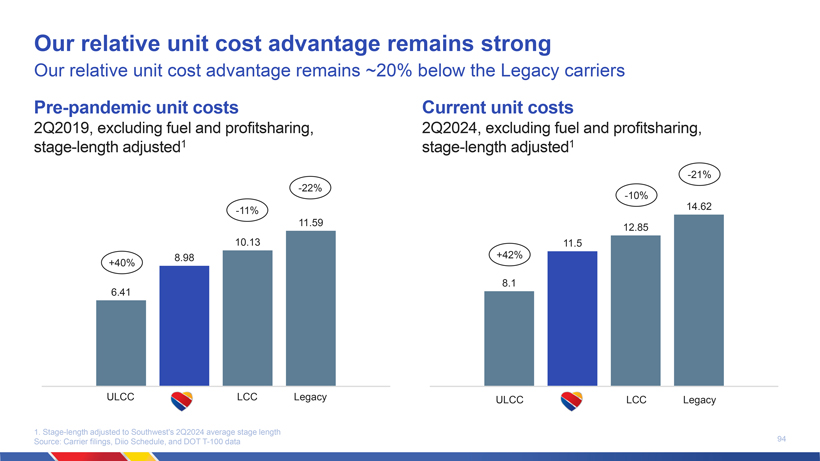
Our relative unit cost advantage remains strong Our relative unit cost advantage remains ~20% below the Legacy carriers Pre-pandemic unit costs Current unit costs 2Q2019, excluding fuel and profitsharing, 2Q2024, excluding fuel and profitsharing, stage-length adjusted1 stage-length adjusted1 -21% -22% -10% -11% 14.62 11.59 12.85 10.13 11.5 8.98 +42% +40% 6.41 8.1 ULCC LCC Legacy ULCC LCC Legacy 1. Stage-length adjusted to Southwests 2Q2024 average stage length 94 Source: Carrier filings, Diio Schedule, and DOT T-100 data
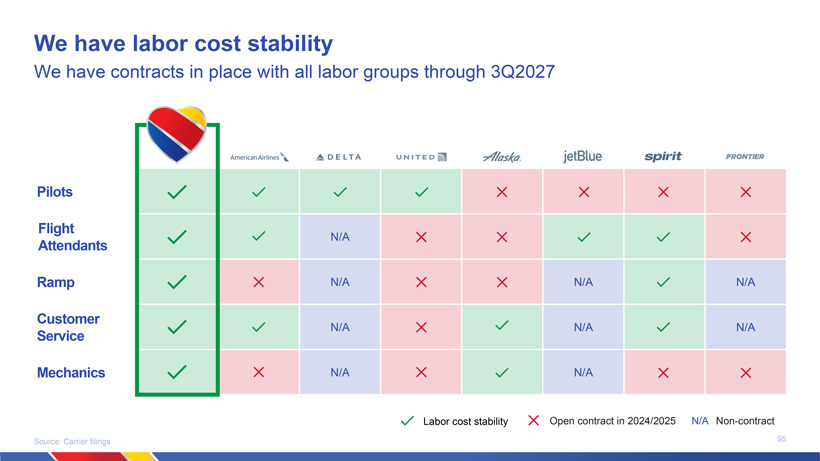
We have labor cost stability We have contracts in place with all labor groups through 3Q2027 Pilots Flight N/A Attendants Ramp N/A N/A N/A Customer N/A N/A N/A Service Mechanics N/A N/A Labor cost stability Open contract in 2024/2025 N/A Non-contract Source: Carrier filings 95
Executing our plan to drive Shareholder returns
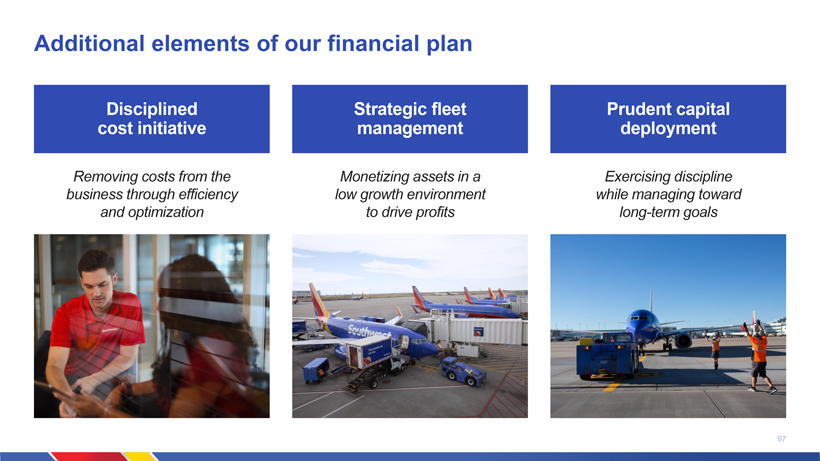
Additional elements of our financial plan Disciplined Strategic fleet Prudent capital cost initiative management deployment Removing costs from the Monetizing assets in a Exercising discipline business through efficiency low growth environment while managing toward and optimization to drive profits long-term goals 97
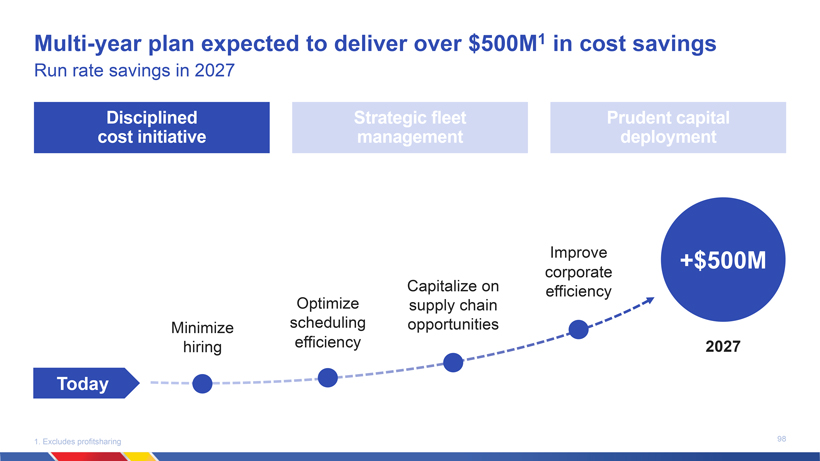
Multi-year plan expected to deliver over $500M1 in cost savings Run rate savings in 2027 Disciplined Strategic fleet Prudent capital cost initiative management deployment Improve +$500M Capitalize on corporate efficiency Optimize supply chain Minimize scheduling opportunities hiring efficiency 2027 Today 1. Excludes profitsharing 98
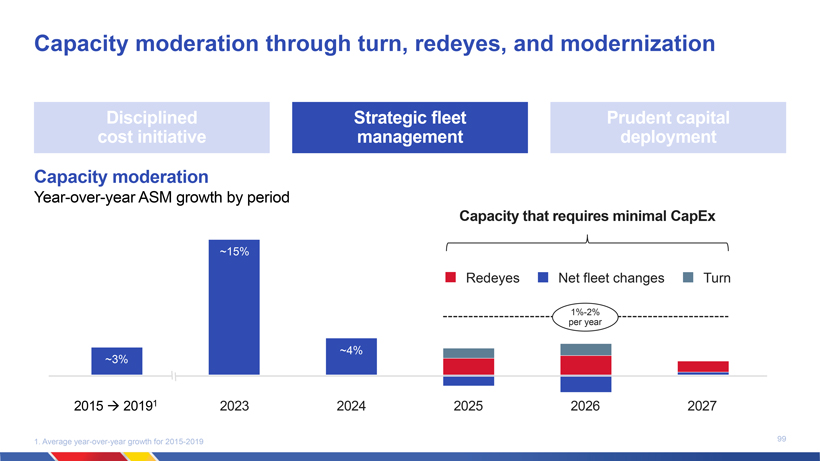
Capacity moderation through turn, redeyes, and modernization Disciplined Strategic fleet Prudent capital cost initiative management deployment Capacity moderation Year-over-year ASM growth by period Capacity that requires minimal CapEx ~15% Redeyes Net fleet changes Turn 1%-2% per year ~4% ~3% 2015 â 20191 2023 2024 2025 2026 2027 1. Average year-over-year growth for 2015-2019 99
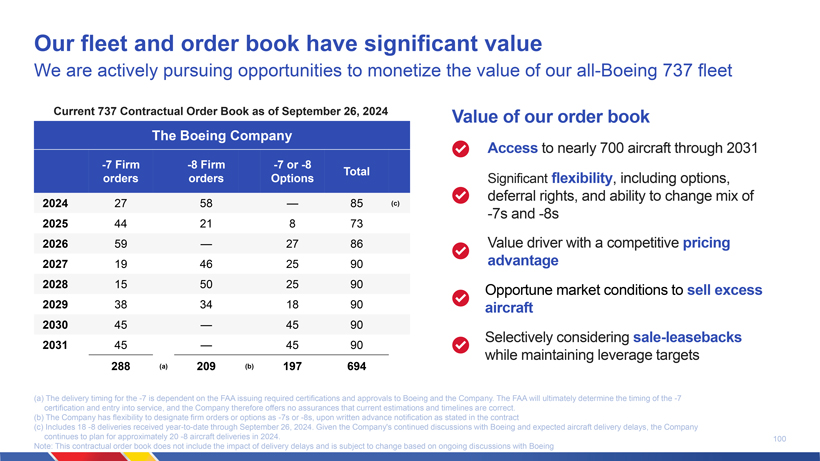
Our fleet and order book have significant value We are actively pursuing opportunities to monetize the value of our all-Boeing 737 fleet Current 737 Contractual Order Book as of September 26, 2024 Value of our order book The Boeing Company Access to nearly 700 aircraft through 2031 -7 Firm -8 Firm -7 or -8 Total orders orders Options Significant flexibility, including options, deferral rights, and ability to change mix of 2024 27 58 85 (c) -7s and -8s 2025 44 21 8 73 2026 59 27 86 Value driver with a competitive pricing 2027 19 46 25 90 advantage 2028 15 50 25 90 Opportune market conditions to sell excess 2029 38 34 18 90 aircraft 2030 45 45 90 Selectively considering sale-leasebacks 2031 45 45 90 while maintaining leverage targets 288 (a) 209 (b) 197 694 (a) The delivery timing for the -7 is dependent on the FAA issuing required certifications and approvals to Boeing and the Company. The FAA will ultimately determine the timing of the -7 certification and entry into service, and the Company therefore offers no assurances that current estimations and timelines are correct. (b) The Company has flexibility to designate firm orders or options as -7s or -8s, upon written advance notification as stated in the contract (c) Includes 18 -8 deliveries received year-to-date through September 26, 2024. Given the Companys continued discussions with Boeing and expected aircraft delivery delays, the Company continues to plan for approximately 20 -8 aircraft deliveries in 2024. 100 Note: This contractual order book does not include the impact of delivery delays and is subject to change based on ongoing discussions with Boeing
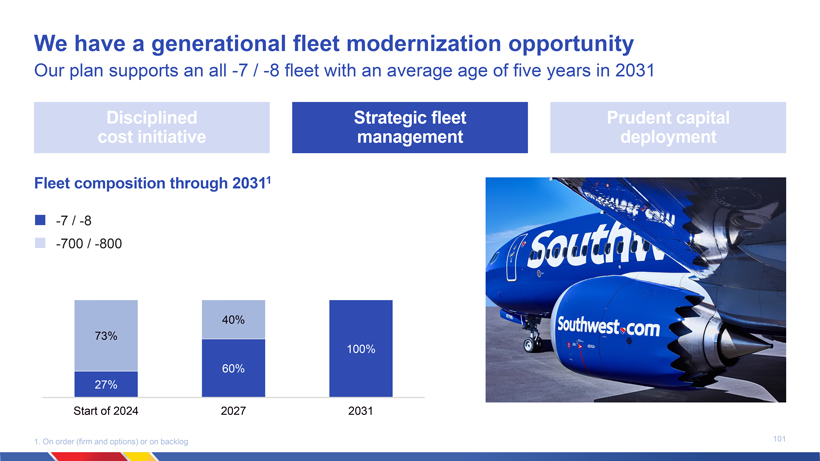
We have a generational fleet modernization opportunity Our plan supports an all -7 / -8 fleet with an average age of five years in 2031 Disciplined Strategic fleet Prudent capital cost initiative management deployment Fleet composition through 20311 -7 / -8 -700 / -800 40% 73% 100% 60% 27% Start of 2024 2027 2031 1. On order (firm and options) or on backlog 101
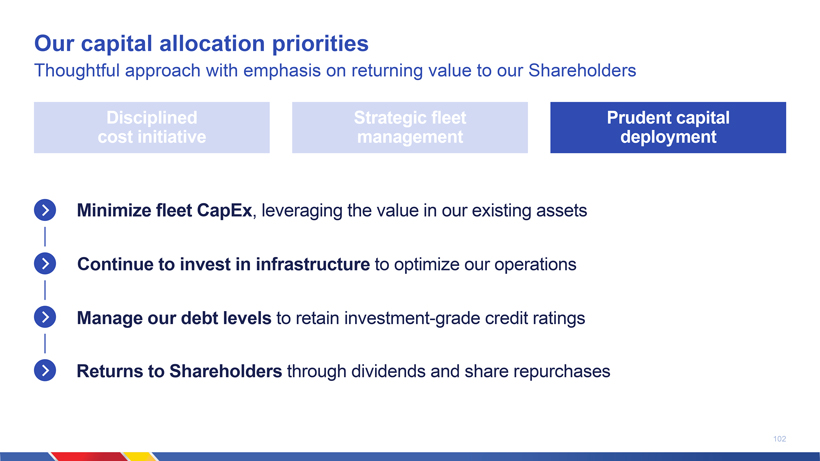
Our capital allocation priorities Thoughtful approach with emphasis on returning value to our Shareholders Disciplined cost initiative Strategic fleet management Prudent capital deployment Minimize fleet CapEx, leveraging the value in our existing assets Continue to invest in infrastructure to optimize our operations Manage our debt levels to retain investment-grade credit ratings Returns to Shareholders through dividends and share repurchases 824168-001 26Sep24 01:21 Page 1102
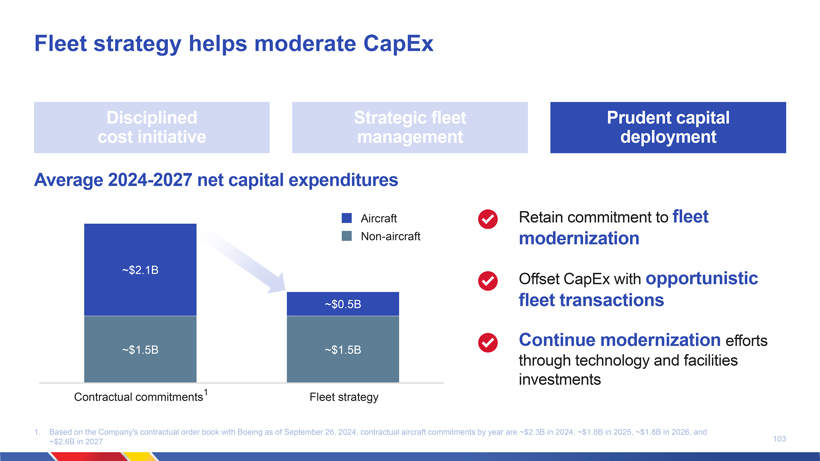
Fleet strategy helps moderate CapEx Disciplined Strategic fleet Prudent capital cost initiative management deployment Average 2024-2027 net capital expenditures Aircraft Retain commitment to fleet Non-aircraft modernization ~$2.1B Offset CapEx with opportunistic ~$0.5B fleet transactions Continue modernization efforts ~$1.5B ~$1.5B through technology and facilities investments Contractual commitments1 Fleet strategy 1. Based on the Companys contractual order book with Boeing as of September 26, 2024, contractual aircraft commitments by year are ~$2.3B in 2024, ~$1.8B in 2025, ~$1.8B in 2026, and 103 ~$2.6B in 2027
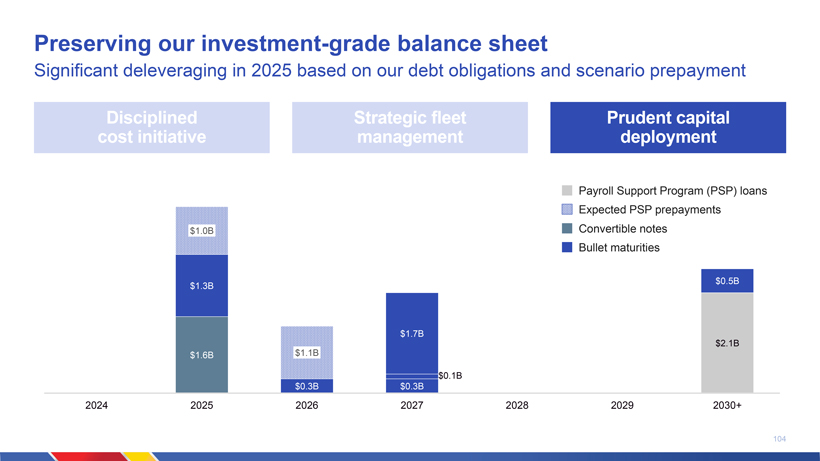
Preserving our investment-grade balance sheet Significant deleveraging in 2025 based on our debt obligations and scenario prepayment Disciplined Strategic fleet Prudent capital cost initiative management deployment Payroll Support Program (PSP) loans Expected PSP prepayments $1.0B Convertible notes Bullet maturities $0.5B $1.3B $1.7B $2.1B $1.6B $1.1B $0.1B $0.3B $0.3B 2024 2025 2026 2027 2028 2029 2030+ 104
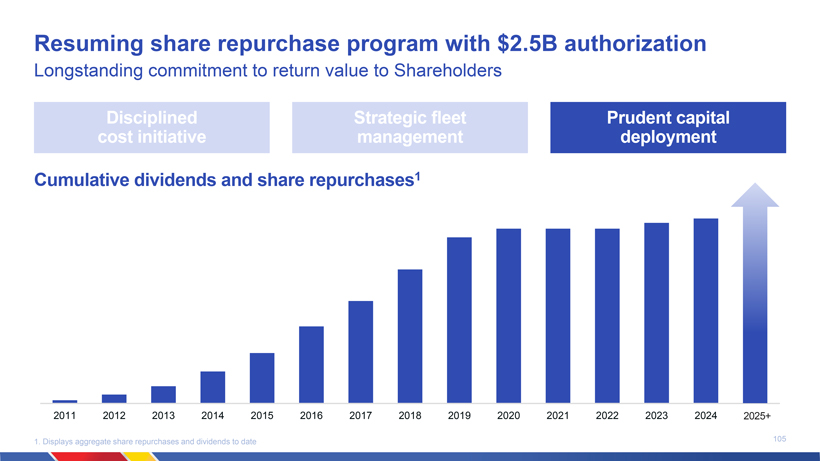
Resuming share repurchase program with $2.5B authorization Longstanding commitment to return value to Shareholders Disciplined Strategic fleet Prudent capital cost initiative management deployment Cumulative dividends and share repurchases1 2011 2012 2013 2014 2015 2016 2017 2018 2019 2020 2021 2022 2023 2024 2025+ 1. Displays aggregate share repurchases and dividends to date 105
Supporting a path to sustainable prosperity
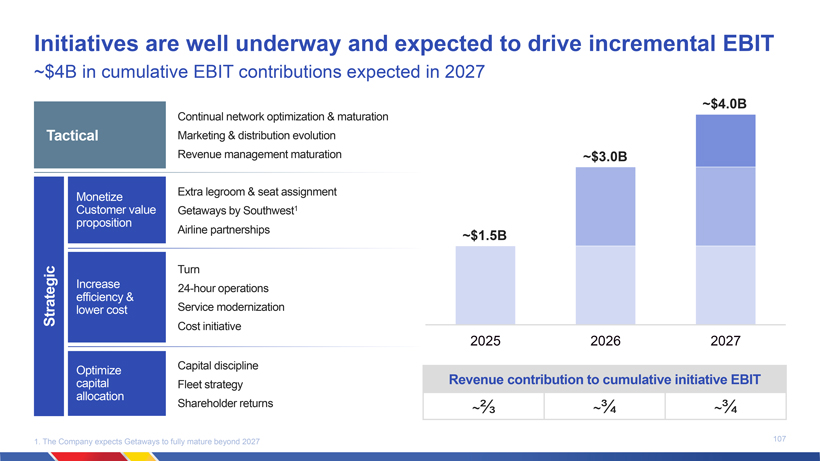
Initiatives are well underway and expected to drive incremental EBIT ~$4B in cumulative EBIT contributions expected in 2027 ~$4.0B Continual network optimization & maturation Tactical Marketing & distribution evolution Revenue management maturation ~$3.0B Monetize Extra legroom & seat assignment Customer value Getaways by Southwest1 proposition Airline partnerships ~$1.5B Turn Increase 24-hour operations efficiency & Service modernization Strategic lower cost Cost initiative 2025 2026 2027 Optimize Capital discipline capital Fleet strategy Revenue contribution to cumulative initiative EBIT allocation Shareholder returns ~2⁄3 ~3⁄4 ~3⁄4 1. The Company expects Getaways to fully mature beyond 2027 107
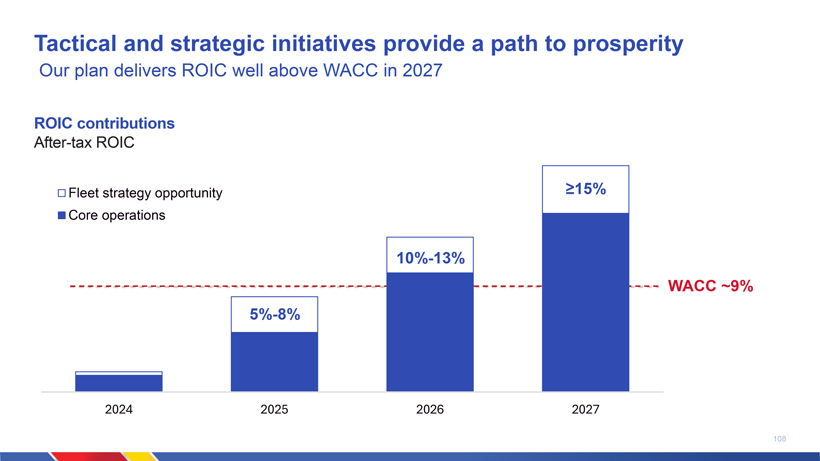
Tactical and strategic initiatives provide a path to prosperity Our plan delivers ROIC well above WACC in 2027 ROIC contributions After-tax ROIC Fleet strategy opportunity ≥15% Core operations 10%-13% WACC ~9% 5%-8% 2024 2025 2026 2027 108
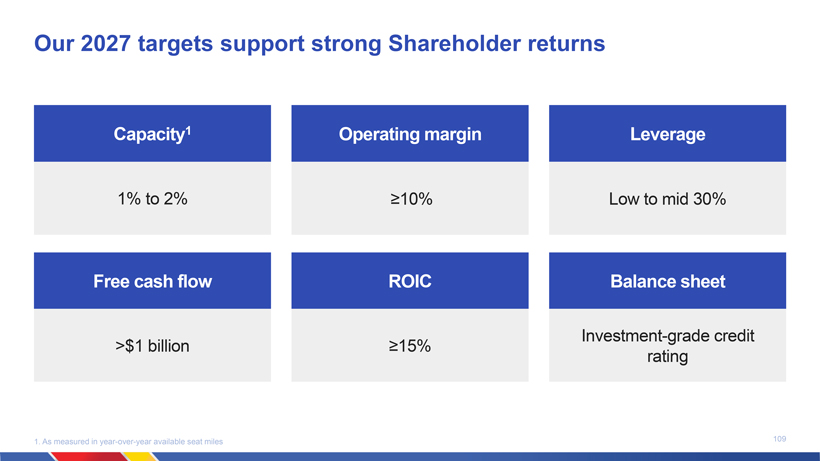
Our 2027 targets support strong Shareholder returns Capacity1 Operating margin Leverage 1% to 2% ≥10% Low to mid 30% Free cash flow ROIC Balance sheet Investment-grade credit >$1 billion ≥15% rating 1. As measured in year-over-year available seat miles 109
Key takeaways Industry-leading balance sheet and a strong foundation Transformational initiative portfolio for sustainable profitability Idiosyncratic opportunities to unlock additional value A clear path to achieve 2027 targets 110

Southwest. Even Better. Bob Jordan
Southwest. Even Better. A strong foundation and industry-leading position Thoughtfully transforming our product as Customer preferences evolve An approach that is rooted in data and research Executing our plan to drive Customer and Shareholder value A comprehensive and measurable plan to deliver ROIC ≥15% 112